
Politics A-level
Summary of content on this page:
IPSOS review of the UK 2024 General Election
CASE STUDY 1: Why do young people not Vote?
CASE STUDY 2: Research into the 1974 UK General Election
CASE STUDY 3: Surveying public opinion in Britain towards defence spending
CASE STUDY 5: Labour governments and managing foreign affairs in the 1960s: What do the polls say?
We have a lot of very interesting content on contemporary Politics in our MORI and NOP collections – particularly on Opinion Polling.
Both Opinion polls and Political Parties are mentioned in the A-Level curriculum, so here is a selection of reports in the Archive that might be of interest to you:
- Who’s Afraid of Election Polls? Normative and Empirical Arguments for the Freedom of Pre-Election Surveys
- The Use and Abuse of Opinion Polls (Robert Worcester)
- A compilation of statistics covering British general elections and by-elections 1945-1970
- NOP Bulletin – Opinion Polls and the 1970 General Election and Post Election Survey 1970
- The Opinion Polls and the 1992 General Election
- The Fluctuating Fortunes of the U.K. Social Democratic Party
We have contemporary opinion polls, surveys on immigration and of immigrants, attitudes to social change such as divorce, abortion, capital and corporal punishment, the financial equality act, attitudes to Mrs Thatcher throughout her tenure as Prime Minister… and lots more. It’s a mine of contemporary material suitable for A-level students.
Scroll down to see two case studies on potential uses of AMSR data in the Politics A-Level.
One of the Archive’s major supporters, IPSOS, has compiled a review of the latest General Election, including some useful comparisons to 1997, and over time.
The report is highly relevant for the A-Level Politics curriculum, which includes the study of three UK elections including 1997.
Click the button below to request and download IPSOS’ ‘How the voters voted in the 2024 election’. The estimates are based on people’s answers to a post-election survey immediately after polling day and explore differences in voting patterns by gender, age, social class and more.
Download IPSOS’ report “How Britain Voted in the 2024
General Election” (Requires registration)
It’s always interesting to look at the latest election, and 2024 provides a very good comparison to 1997!
We have data from all post war UK elections that will help students explore the role and impact of the media in politics. View and download our document summarising data held in the AMSR on ‘Polling in UK Elections since 1945’.
CASE STUDY 1
Why do Young People not Vote?
Data on the 2019 and 2024 Elections shows that turnout overall was 67% and 60% respectively. But for young people (18-24) it was 47% and 37% respectively. And in the 2016 Brexit referendum – despite its political importance – only 36% of 18-24s voted, versus 67% among all adults 18+ and 83% for those aged 65+. Of the 18-24s who did vote in the referendum, 73% voted Remain, versus 40% of the over-65s. So, given the closeness of the result, the low turnout among younger voters, especially 18-24s, most likely swung the outcome, as many commentators noted at the time: that is, Remain would probably have won if the turnout among younger voters had been closer to that of their elders.
See also additional links:
https://www.weareamplify.com/news/brexit-the-young-vote
https://www.statista.com/statistics/520954/brexit-votes-by-age/
Why do young people not vote? If you ask them directly, they tend to suggest that they would, if only it was online! But does that mean this is a relatively recent phenomenon? The Archive lets us look back to 1970, the first general election where voters aged 18 could vote.
Looking back in Time – 1970
We have a Harris poll from April 1970, two months before the election, asking about Intention to vote. And guess what? 18-24s are the least likely to say they will vote – by quite a way, with 49% ‘absolutely certain’ versus 59% among 25-34s, rising to 68% among those aged 55+:
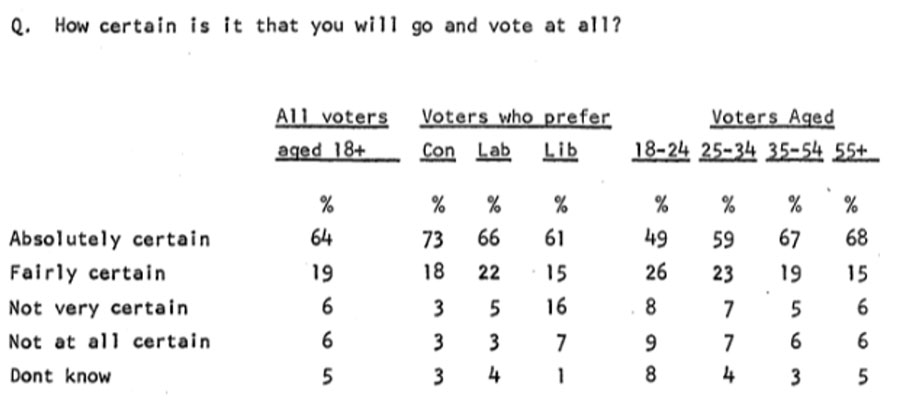
Harris also asked why respondents thought they might not turn out. None of the reasons were unique to the young, they were just a bit more prone to not want to turn out in bad weather, not feel their vote would change the result, not like the parliamentary system, not see much difference between the policies of the parties…
And, perhaps more tellingly (and understandably), they were the least likely to know ahead of the election how they were going to vote. Many were still planning to make their minds up towards the end of the campaign. This, of course, made them an important target group for every party – and particularly the Labour party, for whom they generally had a preference.
Here’s the report:
The Voters’ Decision-Making Processes: The Harris Poll,13th – 19th April 1970 – Opinion Poll Reports – The AMSR Online Archive
Young Labour voters who stayed at home
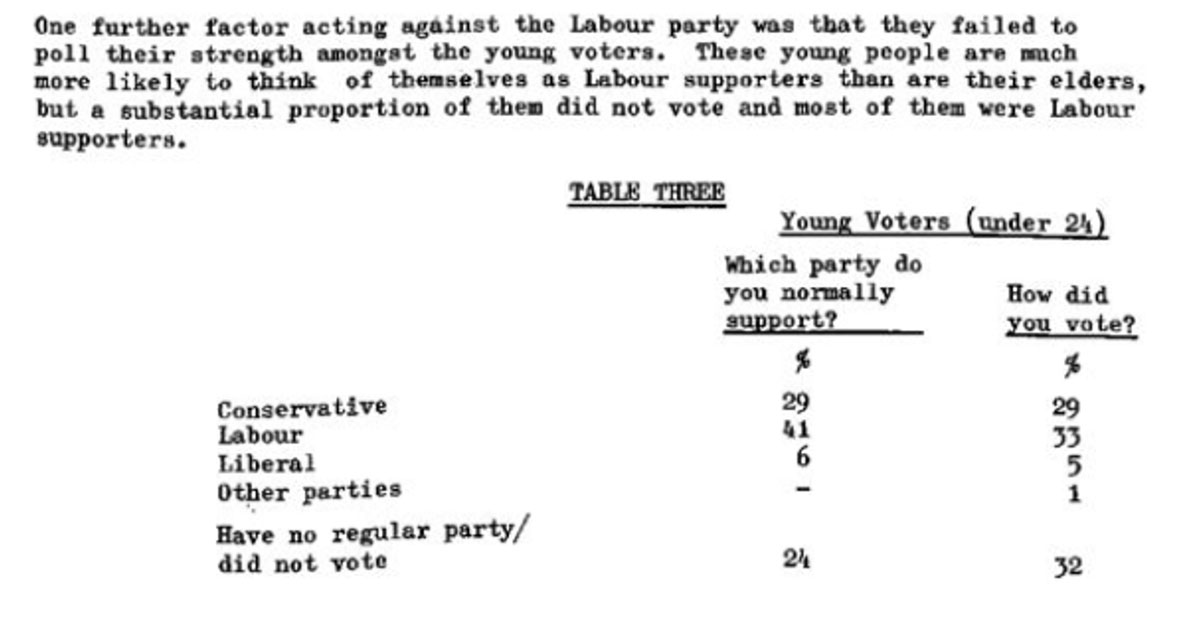
The polls got the result wrong in 1970, which Ted Heath’s Conservatives won against expectations. So extensive post-election recall work was done. And it seems that it was young Labour supporters who in particular did not vote. Here’s a quote from the report:
It’s quite a startling difference! Here’s a link to that report: NOP Bulletin – Opinion Polls and the 1970 General Election and Post recall survey was complete Election Survey 1970, July – NOP Reports – The AMSR Online Archive.
There’s also fascinating data in there on people who changed their minds at the last minute and lots more. But we need to look at the final report on the post-election recall study to see whether the young people’s abstention made a difference…
Did it make a difference?
A month later, work on the recall Post Election Survey was complete, and NOP reported on how people had changed their minds from what they had said in the pre-Election Poll to how they actually voted.
And it was basically last minute switching from Labour to Conservative across all age groups that made the real difference, not young people not voting. Here’s the calculation from the report:
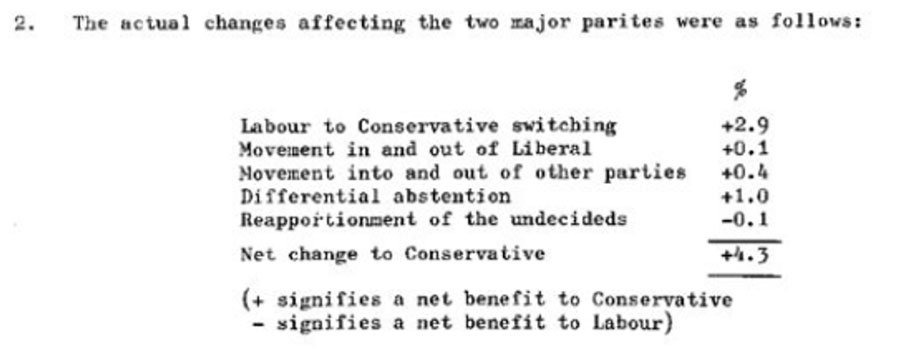
But still, this is only reporting change from prior intention, and as we saw from the earlier Harris Poll, the 18-24s had always had low turnout intentions. If the young people really had turned out in force, who knows? The 70s might have been a very different decade…
It’s interesting to look in the report at why people changed their minds and how late they did it. Here’s the link to the report. NOP Bulletin 1970 August – NOP Reports – The AMSR Online Archive.
What can we learn from this?
Lower turnout among younger voters is not new, although it may be increasing.
In 1970, a majority of young voters with a clear party preference (41% out of 76%) supported Labour. However, they were more likely than their Conservative- and Liberal-supporting contemporaries to stay at home on election day, although the lower turnout among younger Labour supporters was not the main reason for the Conservatives’ unexpected victory, which was largely driven by late switching. In contrast, in the 2016 Brexit referendum, when the young were more likely than their elders to support Remain but also more likely not to vote, their lower turnout may well have been enough to swing the result from Remain to Leave – the opposite of what a clear majority of young voters wanted.
If you’d like to see what young people thought about these issues back in 2009, take a look at these videos:
If you’d like to read about using the ASMR to improve demographic understanding around young people and the vote, look at our in-depth essay by Alex Tan.
CASE STUDY 2
Research into the 1974 General Elections
The two 1974 General Elections are of particular interest at the moment as they have some remarkable similarities with the upcoming election – even 50 years on! The major issues at the time were: inflation, Common Market/EU, energy crisis, strikes, Middle East & Irish troubles/Israel & Ukraine, immigration. And both major parties had unpopular leaders! In the Archive we have NOP reports from:
In the Archive have 3 key NOP reports from 1974:
- NOP Political Bulletin 1974 February – NOP Reports – The AMSR Online Archive (oclc.org)
- NOP Political Bulletin 1974 March/April – NOP Reports – The AMSR Online Archive (oclc.org)
- NOP Political Bulletin 1974 November – NOP Reports – The AMSR Online Archive (oclc.org)
Wikipedia is the best source for the general background.
There were two elections in 1974: the first on Feb 28 which resulted in an (unexpected) dead heat and hung parliament and the second on Oct 10 which gave a Labour victory.
The material we have goes into what the polls got wrong in the February election. It seems that it was mainly due to late switching from Liberal to Labour – confirmed in March/April report. Presumably some Liberals decided that voting Liberal would be a wasted vote?
From these NOP reports three things seem of particular interest, especially from the point of view of a comparison with the 2024 Election:
- Wilson wasn’t actually very popular beforehand – but became very popular afterwards – could there be a parallel with Starmer now?
- Inflation was a key issue at the time – as it is now
- Jeremy Thorpe – and the success of the Liberal party at the time – if he’d gone into coalition with Heath in Feb, who knows what would have happened. Maybe we would have proportional representation by now?
One other interesting thought is that an area of similarity is that both 2024 and 1974 elections will be fought by unpopular leaders of both parties!
If you want to investigate that as a theory, then this report is interesting: from 1973 we have answers to the question – who would make the best PM? NOP Political Bulletin: a Special Report on Public Opinion, April 1973 – August 1973, for the Office of Population Censuses and Surveys – NOP Reports – The AMSR Online Archive (oclc.org)
Another angle that may be worth researching is: do people ‘see’ opinion polls and are they influenced by them? Which seems to have been an issue at the time.
You’ll see from the NOP reports above that the % claiming to have seen the polls was rising steadily: from 56% in 1970, 58% in early 1974, 60% in Oct 1974 to 67% in 1979. And, if you read Worcester’s Conclusion in Pollsters, the Press, and Political Polling in Britain – Opinion Poll Reports – The AMSR Online Archive (oclc.org) there’s a nice quote from Harold Wilson at the end.
There’s also (in the previous section of the same paper) an interesting note that the BBC got the forecast from an exit poll very wrong in the Oct 1974 election. They predicted 150 majority vs 3 actually achieved! Much to the annoyance of Humphrey Taylor. Though it can be seen in British voting trends 1979-1992: exit poll summaries – Opinion Poll Reports – The AMSR Online Archive (oclc.org) that the data was subsequently analysed properly and the exit poll is subsequently described as being accurate.
Arguments about Polls are not new!
The main purpose of researching the 1974 elections was to see what could be learned to reflect upon the upcoming election 50 years later.
Similarities and differences between the 1974 election and now
Similarities:
- major issues are inflation, Common Market/EU, energy crisis, strikes, Middle East & Irish troubles/Israel & Ukraine, immigration.
- Both major parties have relatively unpopular leaders.
- Labour was well ahead (18%) in the polls 18 months ahead of the election NOP Political Bulletin 1972 September – NOP Reports – The AMSR Online Archive (oclc.org) – the gap narrowed a lot towards the election time. 0nly 3.4% in Nov 73: NOP Political Bulletin 1973 November/December – NOP Reports – The AMSR Online Archive (oclc.org). Was the timing of the election driven by the fact that the gap had narrowed?
Differences:
- Unemployment was a major issue then, the Unions were a big problem (who rules Britain?), there was a very strong third (Liberal) party with a popular leader who had been gaining rapidly in the Polls (is this something that could repeat in 2024?)
There are more similarities than differences, and a good question to think about is: whatever would have happened if Jeremy Thorpe had accepted Heath’s invitation to form a coalition after the February election?!! It’s astonishing just how well the Liberal Party were doing at the time, and how very popular Thorpe was. This page in particular shows he was considered the most impressive party leader in Feb 74 : NOP Political Bulletin 1974 February – NOP Reports – The AMSR Online Archive (oclc.org)). Food for thought!
CASE STUDY 3
Surveying public opinion in Britain towards defence spending
Suppose you have to write an essay to address the following question :
‘The latest British Social Attitudes Survey (BSA), an annual survey (started in 1983) that tracks public opinion on social, political, and moral issues in Britain showed a large growth in the number of people supporting increased defence spending: 40% of people now support increased defence spending — double the number who would prefer cuts (20%). How has public opinion on defence spending changed in the post-war period?”
Obviously the first thing to do would be to look at the BSA report, but that only takes you back to 1985. The Gallup Archive online has data from 1965 to 1995, and shows us that only in the Cold War period (1976–1982) did 30-40% of the public think defence spending should be increased. In all other years agreement was much lower. (All links below)
What can we learn from AMSR? A quick search on ‘Defence Spending’ yields some 8-10 polls from NOP and MORI from the 1960’s and 1980’s in which questions are asked in different ways and in different contexts, but they add to the sum of knowledge over the whole period. And the Archive also gives you data for 1938: when the level of public support for increased defence spending was 72%! But given the context (just before WW2) perhaps that is not surprising.
In summary – to write a good, well informed, essay you need to:
- Use different sources for your research – they will give different time periods and different perspectives
- Appreciate that questions asked in different ways will obtain different answers, and think what that means, and how to report them
- Remember to research and understand the social and historic context at any point in time.
See how Dr Ben Clements from the University of Leicester, achieves this very successfully in the essay he wrote on defence spending for AMSR here.
Useful links:
These are some of the polls that the AMSR holds on public opinion towards defence spending and related issues. Further examples can be located by searching the individual collections, in particular:
MORI British Public Opinion
MORI Reports
Opinion Poll Reports
NOP Reports.
Up-to-date polling on the public’s preferences for government spending, including for defence, is available from YouGov’s website:
https://yougov.co.uk/topics/society/trackers/what-sector-should-the-uk-government-spend-more-on
https://yougov.co.uk/topics/society/trackers/what-sector-is-the-uk-government-spending-too-much-on
The BSA surveys offer a long-term perspective, from the early-1980s, on the public’s views on spending on defence (and other areas). In particular, see Table 1 in this report: https://natcen.ac.uk/publications/bsa-42-security-threats-and-military-spending
CASE STUDY 4
Post-War Policy, Politics and Polling – Political Parties
(Link to article by Lorna Lawrence)
CASE STUDY 5
Labour Governments and managing foreign affairs in the 1960s: what do the polls say?
(Link to article by Ben Clements)
We hope that the case studies above inspire you to use the Archive for your studies.
Please do contact us if you have any specific areas that we could help with. We have other reports on other political parties, immigration, crime, capital punishment, Welsh and Scottish independence etc, which are useful for coursework and independent study.
ACCESS THE ARCHIVE
