
Modern British History A-level
The Archive can help with History A-Level non-examined assessments (NEA) and examination topics addressing post-war issues.
We are particularly suitable for use by A-Level students working on the Cambridge OCR module Y113 Britain 1930 – 1997. We have a wide range of material on post war issues which can address key questions in the curriculum. These are discussed below and as well as giving guidance for further study / reading, provide excellent material for exam revision.
The Rise of the Conservative Party (1951–1964)
Study the return of the Conservative Party to power and the economic and social policies of the Conservative government.
The Market Research Society Newsletter Issue 196 1982 July
We had all come a long way from the drab controlled economy that had attended the early post war years and expectations were high about the improvements that most of us could see ahead, both in material and social well-being. Many of the public services that emerged post war, new schools, the National Health Service etc were getting into their stride and many of the material goodies that we have become totally accustomed to since as part and parcel of our lives were beginning to appear in the shops. And it was in fact only a few years later that Harold MacMillan was able to tell us we had never had it so good (1959 general election with landslide victory for Mr MacMillan). That material enhancement of our standard of living continued to increase and indeed for those who are at work is still increasing.
NOP Political Bulletin 1963 May
National Opinion Polls carried out one national survey of voting intentions in May 1963 which revealed a strong recovery in the fortunes of the Conservative party, the first real drop in Labour’s percentage of the vote this year and a halt in the Liberal’s steady decline. The improving economic situation, the early effects of the Budget and even perhaps the weather had restored some confidence in the Tories. But shortly after this poll, the Conservatives were soundly defeated in the local elections and even the committed Tory press seemed determined to make the results appear even blacker than they really were.
NOP Political Bulletin 1963 July
Political Bulletin 20-22 July 1963 showed a dramatic fall in Labour’s lead which fell from 18.7% to 8.3%. The second survey, at the very end of the month, showed a further decline in Labour’s lead which stood at 6.9%.The Liberal decline continued. The signing of the Test Ban Treaty came between the 2 polls and cannot be the principal reason for the Tory recovery. The improvement of the Tory position is probably the result of the improving economic situation, the additional spending power in people’s pockets and the continuing fall in unemployment.
Page 1. NOP Political Bulletin 1963 December Political Bulletin – December 1963
In the December 1963 survey, National Opinion Polls listed 8 important issues, and asked voters which party they thought had the best policies on each of them. If all electors are taken together, Conservative policies are more popular than Labour policies on Education, the Nuclear Bomb, the Modernisation of Britain and Foreign Affairs. Labour policies are more popular on Health, Full Employment, the Cost of Living and Housing. These differences are an important clue as to why Labour has a commanding lead. The policies for which Labour is preferred are very much the same as those which are thought to be most important (see Table 11, November Bulletin). Of the policies for which the Conservatives are preferred, only Education is of comparable importance. Almost half of all Labour voters gave as the most important “The Labour Party would do more for the working classes”. Only 10% of all Labour voters thought that the most important reason was that “The Labour Party has the best policy”.
NOP Political Bulletin 1964 November
We had all come a long way from the drab controlled economy that had attended the early post war years and expectations were high about the improvements that most of us could see ahead, both in material and social well-being. Many of the public services that emerged post war, new schools, the National Health Service etc were getting into their stride and many of the material goodies that we have become totally accustomed to since as part and parcel of our lives were beginning to appear in the shops. And it was in fact only a few years later that Harold MacMillan was able to tell us we had never had it so good (1959 general election with landslide victory for Mr MacMillan). That material enhancement of our standard of living continued to increase and indeed for those who are at work is still increasing.
MRS Conference Papers 35th Annual Conference 1992
Discussion of the significance of social class on British voting behaviour: Despite social class appearing to dominate British politics and manual workers were the largest class, it asks how was it that Labour lost elections? Indeed, in 1959, Labour lost its third election in a row. The Conservative party appeared better able to attract working class votes than Labour was to secure middle-class ones. It was the investigation of this paradox that gave rise to the first studies designed to address trends in the British party system, specifically Labour’s decline. Working class Conservatism is discussed, including impact of traditional social deference and ‘embourgeoisement’ (an early manifestation of Thatcherite philosophy).
Lesson and independent research activity:
The Importance of the ‘Economy’ to Voting intentions and Behaviour
“It’s the economy, stupid” is a phrase coined by James Carville in 1992 to emphasise that economic issues were the central concern of voters during Bill Clinton’s presidential campaign – but is it also true here, during the 1950’s – was MacMillan really saying the same thing when he said ‘we’ve never had it so good’ in 1957?
Have a detailed look at the December 1963 report. Table 1 (page 1) shows clearly how voting intention has been moving over time. Click on Page 4 and look at tables 6, 6a, 6b, which show the relative importance of the 8 issues by party loyalties. And you can deduce which are the most important – the ones to do with the economy – not modernisation or foreign affairs. But do you think this is always the case? i.e. it’s always to do with the economy?
Or look at a later report which analyses the voting patterns in the 1964 election.
Look at pages 7/8/9 – especially by age of completing education – look how few people had been to University (Education completed 19+ – page 9) and the data by gender (page 7) and by class (page 8) . Patterns which are completely changed now.
Nuclear Weapons
Here’s an article on attitudes to Nuclear Weapons in the 1960s
Newspapers and Magazines – Readership
Here is some background to ordinary life in the ’50s and ’60s.
The Swinging Sixties and Social Change (1960s)
Analyse the social and cultural changes of the Swinging Sixties, including the impact of immigration on British society. Assess the reasons for the sexual revolution in Britain in the 1960s and 1970s.
1: The Impact of Immigration
Please note that some language found in question wordings from the 1960s reflects attitudes of the time and may not be considered acceptable in contemporary British society.
NOP Bulletin 1968 March, Page 7
This study looks at a number of questions that were asked about views on immigration following introduction of new legislation:
- Just under 40% of the voters think that the door should be completely closed to coloured immigrants, and 37% believe that the time has come to impose an absolute ban on all immigration to Britain.
- 59% believe that the coloured immigrants who are already here should be encouraged to go home. This includes 63% of Conservatives and of those aged 55 and over. People who live in the Midlands are more inclined to believe that the immigrants should be encouraged to go home than people who live elsewhere.
- There is broad agreement that coloured immigrants can best be assimilated by ensuring that they are widely scattered over country, and not concentrated in a limited number of places. 59% of the electorate take this view, including 65% of men and 65% who live in conurbations (where most of the immigrants also live). It is clear that the local authorities who have been demanding dispersal have public opinion on their side.
- 27% say that without the coloured immigrants, public transport would break down. This view is most prevalent among ABs (36%) and in conurbation areas (31%). 70% believe that coloured immigrants should be allowed in as long as they have a job to go to. This suggests that the employment factor, at a time when there is a good deal of unemployment, is a vital one, because clearly there are some electors who first say that they want to ban coloured immigration and then change their minds in respect of coloured immigrants who have a job to go to.
- Only 39% admit that they would not want a coloured family as neighbours. This includes no more than 30% of those aged between 21 and 34 but 45% of electors aged 55 and over. It also includes 47% of those living in the Midlands, but only 37% of people living in other parts of Britain.
- Most voters think that ‘people with British passports should be allowed to come to Britain whenever they like’. In this case, there are no marked differences by age, class or region.
- 27% consider that only Intellectuals are in favour of coloured immigration. The figure for conurbations is 32%, but elsewhere it is only 24%.
60 years of Social Survey 1941 – 2001 (2001), Page 18
Regarding immigration (NB this is from the section covering the 1950’s rather than 1960’s): At a time of high immigration, the British government became increasingly concerned about ignorance of, and prejudice towards, ‘coloured’ people. Although most Britons had grown up thinking the Empire was a great achievement and that the colonies had supported the UK during the war, the government was unsure how they would receive the growing numbers of colonial immigrants coming to take up unfilled vacancies. In 1951, the Colonial Office organised a series of public exhibitions to promote positive images of coloured people and commissioned ‘a study of public knowledge of the Colonies and of attitudes toward coloured people’.
The study confirmed the Colonial Office’s suspicions. Nearly 60 percent of respondents couldn’t name a British colony. Although three quarters of the sample thought Britain would be worse off without the colonies, there was clear evidence of prejudice, particularly among older people. One in three respondents said they disliked coloured colonials, though most claimed that while other people were prejudiced, their feelings were perfectly legitimate – justified by immigrants’ allegedly unpleasant habits. The report was marked confidential and remained in the files until the classification was lifted 30 years later.
Mentions the introduction of the International Passenger Survey (IPS) in 1961 which was a study begun in response to huge rise in overseas tourism and growing public concern about immigration.
Lesson and independent research activity:
How effectively did British governments deal with issues of race relations and immigration in the 1970s?
We have an NOP Report on Immigration and Race Relations which includes a survey of Asian and West Indian communities. And a Harris Poll on the Issues of the coming Election. Both are very relevant.
The NOP Political Bulletin 1973 November/December contains an article on Enoch Powell and his effect on Race Relations.
Also a MORI report: MORI BPO (1997) – which includes data on voting by ethnicity (p2) and laws on racial discrimination (p18), and another: MORI BPO (Nov 2001) includes data on ‘Views of British Asians post 9/11.
What was life like in the 1970s?
On a lighter note this is a nice summary of life in Britain at the beginning of the 1970s: What were we like in 1969-1972? – AMSR
Or how have eating habits changed ?: TGI: what did we eat in 1969? – AMSR
Or try this for some interesting comparisons of then and now: Have we changed in the last 50 years? – AMSR
Or, How does Christmas 1969 compare to now? – AMSR
2: The Sexual Revolution
NETWORK: Newsletter of the British Sociological Association no. 47 1990 May, page 10
Notes on the life of Ruth Glass, a German-born British sociologist, urban planner and founder of the Centre for Urban Studies at University College London, are written from the perspective of one of the young women who were reading sociology at the LSE in the late fifties and early sixties:
‘It is arguable that the sixties were the peak of sexism in academic and intellectual circles. Certainly where the last pre-war issue of the Encyclopedia of the Social Sciences had a number of pages devoted to women and women’s issues, the sixties edition had none. Sexual harassment was considered as amusing, rubbishing women colleagues was seen as fair game, especially if they were mothers too. And women like Ruth Glass or Hilde Himmelweit who were beautiful as well as outstandingly clever, were special targets. (There were some conspicuous exceptions amongst the men who were good colleagues and allies). Although at the time we women students were reading De Beauvour we neither had the vocabulary nor the collective strength to enable us to denounce such practices publically, although it is true as Terry Morris points out that we did denounce other social injustices, not least the horrors of the Vietnam War. The point was that although we engaged in a lot of activities, easily recognisable today as feminist, then they were just things that one did. Women had yet to take possession of our own politics. For example before the 1967 Abortion Act I was part of a network which organised abortions, setting up the money was a formidable job – at current prices a legal abortion would have cost £1,000.We didn’t have the vocabulary to be able to make the longed for alliances with these gifted women, That vocabulary and that ability to support one another came only with the women’s movement’.
Values and Trends amongst the Boomer Generation (1997)
RIO (Research International Observer) is an annual, qualitative research programme carried out through Research International’s companies all over the world. The purpose of RIO is to provide those involved in marketing and advertising with a better understanding of the world consumer and offer insight into the potential to optimise brands, products and communication across international markets. This report deals with Values and Trends Amongst The Boomer Generation.
Publication discusses this particular point in history when there were significant readjustments after WW2. There are comparisons of key characteristics of the Boomer Generation in different countries. The social revolution of the 60’s and 70’s meant that even if they did not personally take a really active part in it, music, gender norms, fashion, press freedoms and so on were all changed during Boomers’ youth and young adulthood. There was an emergence of a new “generation” – the teenager/youth – existing between childhood and adulthood.
Looking specifically at the sexual revolution, birth control meant that women could take sexual risks in many countries from the sixties onwards. It is true that there was very little overt discussion or admission of sexual promiscuity at that time, but contraception was perceived as a benefit emanating from the mid to late 60’s which had totally changed the face of gender relations forever. We suspect some underlying guilt about loosening sexual relations, however, since one of the modern concerns is sexually transmitted disease, and especially AIDS which, in general, our Boomers have escaped. However, the ongoing liberalisation of sexual behaviour is felt at least partly to blame for the spread of AIDS and some Boomers are backtracking on their earlier attitude to sexual freedom.
60 years of Social Survey 1941 – 2001(2001), Page 18
Publication briefly covers many aspects of social research conducted in the 1960’s, a time which saw a rapid expansion in social research. Areas include attitudes to travel, road safety (attitudes to seat belts), the police, housing (particularly rental housing), noise pollution, sending greetings cards, smoking, alcohol, family spending, diet, women and sexual liberation, leisure, the economy, NHS and dental health, disability.
In terms of the sexual revolution, this publication discusses the introduction of the contraceptive pill in1961 noting changes in sexual attitudes led to an increase in illegitimate births and rise in adoptions. It states that relatively few people took part in the ‘rock and roll’ and ‘free love’ hedonism associated with the 1960s, with leisure time being dominated by watching television; men and women spent 23% of their leisure time watching television.
How we’ve changed: social trends from post-war to present day and beyond, Page 5 (2022)
An AMSR publication covering 12 topics considered relevant to most people. Some are wide ranging, such as ‘Food’; others, such as ‘Generational cohorts’, are more specific. Topics such as ‘Diversity’, ‘Green issues’ and ‘Happiness’ are included.
There is a chapter on changing food trends (Page 10): Many factors involved in why tastes have become more sophisticated since 1946, including growth in foreign travel and arrival in Britain of immigrant communities.
The chapter on Women in the Home (Page 20) focuses on the design and consumption of aspirational goods in post-war Britain, brought about by greater wealth, social mobility and a fervent remodelling of home life in the face of a boom of new housebuilding that took place in the decades after WWII. The kitchen became less a site where the housewife went about her duties but more a social hub, a site of self- realisation and a better world articulated through design and, in particular, labour saving devices for the home.
Researching the public: post-war politics, policy and polling (2023)
Not until the 1960s were studies of sexual attitudes and behaviours carried out using robust modern survey techniques, including probability sampling to ensure the representativeness of participants. The focus of such studies tended to reflect contemporary preoccupations. Concern for the sexual mores of post-World War II youth, for example, resulted in many studies in the 1960s and 1970s focusing on the sexual attitudes and behaviours of young people (Schofield 1965, 1973; Farrell 1978), while the advent of reliable contraception coinciding with the softening of divorce laws in 1961 prompted a focus on the family building practices of women of reproductive age (OPCS 1985). For example before the 1967 Abortion Act I was part of a network which organised abortions, setting up the money was a formidable job – at current prices a legal abortion would have cost £1,000.We didn’t have the vocabulary to be able to make the longed for alliances with these gifted women, That vocabulary and that ability to support one another came only with the women’s movement’.
Lesson and independent research activity:
Another way of looking at the effect of the 60’s is to look at the number of the great government liberalising Acts which were actually passed during this time. The 1960s witnessed a remarkable wave of social reform in Britain, much of it driven not by government but by backbench MPs using Private Members’ Bills. Together, these Acts reshaped personal freedom, modernised social attitudes, and dismantled long‑standing Victorian restrictions.
Abortion Act 1967 – Legalised abortion under specified conditions, transforming women’s reproductive healthcare and reducing unsafe, illegal procedures.
Sexual Offences Act 1967 – Partially decriminalised homosexual acts between consenting men over 21 in private — the first major step away from criminalisation.
Race Relations Acts 1965 & 1968 – The 1965 Act outlawed discrimination in public places; the 1968 Act extended this to housing, employment, and services, establishing the Race Relations Board.
Abolition of the Death Penalty (Murder) Act 1965 – Suspended (and later made permanent) the abolition of capital punishment for murder, marking a major shift in criminal justice philosophy.
Theatres Act 1968 – Ended state censorship of the stage by the Lord Chamberlain, opening the way for modern theatre and artistic freedom.
Family Planning Act 1967– Enabled local authorities to provide contraceptive advice and supplies, including to unmarried women — a quiet but significant reform.
Divorce Reform Act 1969 – Introduced “irretrievable breakdown” as the sole ground for divorce, making the process more humane and accessible.
Representation of the People Act 1969 – Lowered the voting age from 21 to 18, expanding democratic participation to a new generation.
Equal Pay Act 1970 – Required equal pay for men and women doing the same or broadly similar work.
The 60’s were central to understanding Britain’s transition into a more open, egalitarian society. You can look in the Archive for Public attitudes to these Bills as they were going through Parliament
Or thinking about the Sexual revolution see this story: How have perceptions of contraception changed? – AMSR
The Labour Government of 1964–1970
Focus on the government of Harold Wilson, including the economy and strikes.
NOP Political Bulletin 1964 November
There is plenty of support for the new Government. Since the election, Labour have held leads of 14.1%, 11.3% and 13.4%.The latest figure is enough to give Labour a majority of 180 seats at a General Election. After an election, there is almost always a tendency for people to support the winning party. A lot of people who have voted Conservative are not now prepared to admit that they did so. However, this tendency does not by itself seem sufficient to explain the continued high popularity of the Government. They have maintained their position in spite of much unpopular legislation and in the face of fierce criticism, especially from the press. Although the Liberals scored a spectacular success at the election, this does not appear to have persuaded other electors to join them. Their position has worsened from 12.0% in October to 10.4%.
Mr Wilson seems to have come up to the electorate’s expectations. Almost the same proportion are satisfied with him as Prime Minister as were satisfied with him as Leader of the Opposition in the last few months before the election. The present Government is as popular as the Conservative Government ever was since NOP first asked the question in 1961. Far fewer electors are dissatisfied with Labour than were dissatisfied with the Conservatives. Others would appear to be withholding judgment until the Government has been in office longer. Yet, in the last few weeks, the proportion of those dissatisfied has increased by 6.5%, mainly at the expense of the ‘don’t knows’.
NOP Bulletin 1965 March
The latest NOP survey (published here for the first time) shows a Labour lead of 9.5%. This confirms the Labour lead of 9% found by the previous poll a fortnight earlier. A lead of this size represents a swing of 3.5% from Conservative to Labour since the General Election, and would give Labour a majority of between 130 and 150 seats. This poll was carried out before the Budget. The Liberal vote has risen by more than 3% following the Roxburgh by-election. The immediate effect of the Orpington by-election in 1962 was far greater, and pushed the Liberal vote up from 19% to 30%. Before March the Labour lead had been falling steadily from the post- Election peak. Why has this trend been reversed?
The actions of Mr Wilson himself may also provide an answer. The Prime Minister has given the impression of moving towards the centre in the same way that President Johnson has been trying to establish a national consensus. His firm reaction to pressure from the Left Wing of his own party, and his nuclear and South East Asian policies suggest an attempt to make the Labour Government a “government of all the people” and not a doctrinaire socialist government. The explanation for this is to be found rather in the personality of the Prime Minister himself. Mr Wilson’s popularity remained virtually unchanged even when the number “satisfied” with the Government was falling. The proportion of those “satisfied” with him has risen substantially this month, to the highest point to date.
NOP Bulletin 1966 November
The gap between the two main parties has narrowed to 4.5%, the smallest Labour lead recorded by NOP since the General Election in March 1966, The Conservative share of the vote has risen to its highest level for a year, and the Liberals have lost a good deal of ground on the latest poll. There has, however, been no sharp improvement in Mr Heath’s rating, though his popularity has at last increased among Conservative voters.
The most likely explanation for the decline in Labour’s fortunes is public dissatisfaction with the economic situation. It is noteworthy that the recent movement of opinion away from Labour and towards the Conservatives has been sharper in Scotland, in the North and in the Midlands than in Southern England. Labour is losing support in areas where unemployment is usually above the national average, and in places which have been hardest hit by the squeeze. In the long run this may be ominous for the Government – it is worth remembering that in 1964 some of the largest swings to Labour occurred in constituencies, many of them marginal, where unemployment had been notably high under the Conservatives in the winter of 1962-1963.
The level of satisfaction with the Government on the 1 November survey was the lowest recorded since Labour took office in October 1964. On the latest poll, however, the Government’s rating improved slightly, and 42% of the electorate are now satisfied with the way the Government is running the country. This improvement is almost entirely due to the fact that the proportion of Labour voters who are satisfied with the Government has increased from 72% to 78%. Only10% of Conservatives and 23% of Liberal supporters are satisfied with the Government’s handling of the nation’s affairs.
Only 9% of the electorate claim that their opinion of the Government has improved since the General Election in March. 46% state that their opinion of the Government has deteriorated. The party breakdowns show that since September, when this question was previously asked, the Government has lost ground among the supporters of all three parties.
NOP Bulletin 1967 April
The main cause of the Government’s decline seems to be the prices and incomes policy. At Brierley Hill, NOP found that more than half of those who were deserting the Labour party spontaneously mentioned the wage freeze, combined with rising prices, as the main reason for their dissatisfaction with the Government.
The great majority of these disillusioned electors were working-class, and there are figures in this Bulletin which suggest that it is among the working-classes that Labour has lost most ground over the country as a whole since I966, Half the electorate now think that the wage freeze should not continue. Three out of ten think they would be better off under the Tories, and only15% believe they would be worse off. If the Government decide to continue on their present economic course, they may be heading for their first period of sustained unpopularity since they were elected in 1964.Their main hopes must be that the storm which has hit them will blow itself out during the less political summer months, and that the decision to try and join Europe will do the Government more good than harm.
When NOP last asked questions about the Common Market, in February, 52% were in favour of trying to join (compared with 62% last July) and 26% were opposed (including 20% of Labour supporters). It may be that the actual making of the decision will swing some support behind the Government, but it seems certain that the next series of by-elections will produce a crop of anti-market candidates. It will be interesting to see where their votes come from.
NOP Bulletin 1969 April
With the Labour party still in the electoral doldrums, and with talk of an October General Election, it seems interesting to consider the type of support the three main parties are enjoying now, relative to that which they have had since the last election. A quick look at the voting intention by class shows a significant movement of the skilled and unskilled working classes away from Labour. The similar movement among the middle classes is, however, not as great. The attempt, whether intentional or not, to broaden the electoral base of the Labour party by attracting the middle classes has in fact alienated the working classes, originally the most steadfast backbone of the party. The swing within the various class groups since the 1966 General Election shows that the skilled working class has swung to the Conservatives more than in proportion to the other class groups, with the unskilled working class showing the next highest swing.
Since February, the electors’ opinions about the Government’s economic management have become more critical. 65% of the British electorate describe the Labour Government’s economic activities as bad – an increase of since February.
The Government’s handling of the economy is considered favourable by 57% of the Labour supporters. Among the other two parties, however, more than 70% believe the Government is making a bad job of handling Britain’s economic affairs. In all class categories a majority believe the Government is making a bad job of economic management. It seems that the class effect is less significant as a discriminant here than in voting intention. Thus though a larger proportion of unskilled, working class electors vote Labour than Conservative, a larger proportion believe the Government is doing a bad job rather than a good job at economic management. This possibly reflects the effect of the Government’s actions against strikes and industrial disputes as felt by these unskilled working class electors.
NOP Bulletin 1969 July
The 1968-69 Parliamentary session ends with the Conservatives with an 18% lead over Labour in the country, with neither of the two -party leaders attracting more than 40% of the support of the electorate and with the electorate on the whole dissatisfied with the Government’s performance. This is a situation which has not been equalled at this juncture of any party’s period of office since NOP began taking the nation’s pulse. It looks foreboding to the Labour party’s chances at the next election – even without complete implementation of the Boundary Commissions reports.
One of the highlights of the last session was the Government’s attempt to reform industrial relations, particularly to regulate strikes and strike procedures, NOP’s coverage of this area consistently showed evidence of the electorate’s support for the Government’s proposals in this field. If anything, the Trade Union movement has become less popular over this time. In August, 1968, the country was divided on the question of whether the trade unions exerted a good or bad influence on Britain. In March 1969, those thinking the unions were a bad influence outnumbered those thinking they were a good influence by 2 to 1.
The industrial situation in March this year was, however, stormier than in August 1968 and to some extent this may have set the tone. But by March, also, the electors’ opinions about the power of the Unions had polarised. In August, I968 half the electorate thought the unions were too powerful, 28% thought they were all right and 10% thought they had too little power. In March 1969 only 6% thought they were about right while 62% thought they were too powerful and 22% too weak. The Government’s major proposals seem to have had the support of a clear majority of the electorate in August 1968, January 1969 and May 1969. The cooling off period and the secret ballot of union members before a strike were approved of by almost three quarters of the electorate and even the major bone of contention – punitive measures for disobedient strikers – was agreed to by a majority, including a majority of unionists.
In June the Government’s industrial reform proposals were shelved and the TUC took the responsibility for dealing with unofficial strikes. The electorate was relatively pessimistic about this move. Though 20% did not know how effective the TUC would be in fulfilling their responsibility, a majority of those giving an opinion thought the TUC would be ineffective. The situation, however, is still relatively unsettled. The TUC seem to have failed to settle the Port Talbot blast furnacemen’s strike under the terms of their agreement with the Government. And at this time, strikes seem to be relatively significant to the electors, as an issue facing the Government. Depending on the industrial issues of the next months the Government may be under severe pressure in the coming parliamentary session to reintroduce their industrial reform bill.
Economic problems dominate the elector’s views of the situation facing the Government at present, with 75% of the electorate mentioning one of the three specifically economic items – cost of living, strikes, balance of payments – as the most important issue. Of the three, however, the cost of living was considered the most important issue by 38% of the electorate, double the proportion thinking any other single item most important. The next most important issue is strikes, followed by balance of payments. Thus not only is the electors political interest focussed on the economic area, it is also involved with a field which has received much Government attention over the past six months – and which was specifically mentioned in Mr Jenkins’ Budget speech this year – strikes.
NOP Bulletin – Opinion Polls and the 1970 General Election and Post Election Survey 1970, July, Page 6
This is a summary of the main findings of a NOP post-election survey following the 1970 general election: The additional strength required to carry the Conservatives to an Election victory was found to be as follows:
- The Tories made considerable gains from those who had voted Labour in 1966.
- Labour lost more of their 1966 strength through abstention than did the Tories.
- Whilst young electors are much more likely than their elders to support Labour theoretically, in practice there was substantial abstention amongst this group; and most of those who did not vote were Labour supporters.
The main reason for the Tories being able to win this support was the Cost of Living situation, the enduring inability of the Labour government to beat the problem, and Conservative promises to do so. Comparison with a pre-Election NOP survey shows that the problem retained constant importance throughout the campaign; but the majority who thought the Conservatives the best team to beat the problem doubled during the three weeks leading up to 18 June. In terms of personal popularity, the Conservatives won despite rather than because of Ted Heath; more electors would still prefer to see Harold Wilson than Mr Heath as Prime Minister. However, the Tories seem to have fought a substantially better campaign than Labour, particularly on television. The campaign in general generated much less interest than did the 1966 campaign. And what interest existed was aroused by policies, whilst in 1966 more interest was aroused by personalities.
Lesson and independent research activity:
Why do young people not vote?
An interesting aspect of the 1970 election is that it was the first time that 18-20 year olds could vote. The turnout was not great. Look at these sources if you want to see how the young voters behave over time: UK Election statistics 1945-2003; UK Election statistics 1945-2003; VUK0014 – Evidence on Voter engagement in the UK.
Or here are two links to what the young people themselves think about it:
– What are the pros and cons for lowering the voting age to 16? (Students) – Vox Pops Videos – The AMSR Online Archive
– Do you think current affairs and politics should be compulsory subjects in state schools? (Students) – Vox Pops Videos – The AMSR Online Archive.
If you like you could do research amongst your friends on whether they intend to vote, and if not why not? Do we need more education on the matter, do you think? It might be an interesting EPQ?
What effect will giving 16 -17 year olds the vote have, do you think? Remember that there are not very many of them compared to the total electorate and if they don’t turn out…
UK/US Relations – The War in Vietnam
It is often said that ‘the only thing you learn from history is that nobody learns anything from history’ and it has been interesting that in recent discussions about the war in Iran and Britain’s role vis-à-vis the US, several commentators have remarked on parallels to the 1960s when the issue was whether Britain should get involved in the Vietnam war.
It is generally accepted that Harold Wilson handled relations with the US well. He kept Britain out of direct military involvement in Vietnam while providing covert support to the US and pursuing diplomatic efforts to mediate the conflict.
But it is also interesting to look at Public Opinion as measured in the Polls of the time. Ben Clements (Associate Professor in Politics, in the School of History, Politics and International Relations, University of Leicester) is an expert in this area, and has written an article for AMSR specifically on the subject. Do read it, both for the specific issue of UK/US relations but also because he points out that even at the time the public were more concerned about the ‘Cost of Living’ than the Vietnam war (note that inflation was pretty high in the mid 70’s – it hit 25% in 1975!). Which brings to mind another phrase which is often repeated these days ‘It’s the Economy, stupid!’ used by Bill Clinton in his successful 1992 Presidential campaign.
You could also look at current public opinion of the Iran war (The Iran Conflict | Ipsos) and in the AMSR Archive for public views of the Iraq War: Polls on Iraq, 2001-2010 to compare public opinion to the three conflicts. I think you’ll be surprised re. Vietnam: Public opinion moved from mild approval /uncertainty to clear opposition. Re Iraq: Public opinion was consistently sceptical, majority opposed, and highly conditional on UN approval.
The Winter of Discontent & Thatcher's Rise (1970s–80s)
Study the economic difficulties and the rise of Margaret Thatcher and her Conservative government’s policies. How effectively did British governments deal with issues of race relations and immigration in the 1970s? Review the 1970 and 1974 General Elections, opinion polling and public attitudes to Heath, Wilson and Thorpe.
1: Winter of Discontent and Rise of Margaret Thatcher and her Conservative Government’s policies
NOP Political, Social, Economic Review Issue no.18 1979 March
After the decision not to hold a September General Election, Labour held consistent leads over the Conservatives in NOP random probability polls until January 1979. Between January and February 1979 a dramatic reversal occurred, as the Conservatives opened up an 8% lead over Labour: quota polls by NOP (1–3 Feb) and its sister company, MORI (30 Jan –1 Feb) found even larger Conservative leads – 18% and 19% respectively. This change reflected widespread dissatisfaction with the Government’s handling of January’s strikes and secondary picketing.
As Mr Callaghan has fared badly over the recent industrial problems, so Mrs Thatcher has increased her popularity. For the first time since August 1977 more of the electorate are now satisfied with her (42%) than Mr Callaghan (38%). The percentage of the electorate satisfied with her as Leader of the Opposition rose 7% between December 7th 1978 and February 8th 1979, from 35% to 42%. This improvement was greater among Liberal and Conservative supporters (9% increase) than Labour supporters (5% increase).
Mrs Thatcher is now more popular with Labour supporters (24% satisfied with her) than Mr Callaghan is with Conservatives (14% satisfied). These changes underline the extent of Mr Callaghan’s loss of popularity, and Mrs Thatcher’s gains, as a result of January’s unrest on the industrial front.
NOP Political, Social, Economic Review Issue no.21 1979 October
During the “winter of discontent” of 1978/79, while there were first wide-spread strikes and then indications that inflation would begin to rise dramatically as a result of the pay-claims awarded, confidence fell quite noticeably. The new government in May, with its promises of cuts in income tax and its pledge to give the individual more freedom to spend his money as he saw fit, prompted a rise.
NOP Political, Social, Economic Review Issue no.30 1981 April
Conservative voters were first asked their opinions of Mrs Thatcher and it is clear that they thought much more highly of her than do the electorate as a whole, the average view of Mrs Thatcher is half-way between fair and good.
Despite this generally favourable rating, only slightly over half of the Conservative voters would like to see Mrs Thatcher still at the helm when the Tories go into the next election. She can, however, draw considerable comfort from the fact that there is no one alternative who commands any real amount of support. Mr Heath was the most favoured alternative, but even he was named by only 9% of Tory voters, and the next most popular candidate, Lord Carrington, was named by only 4%.
Tory voters were asked what they thought of Mrs Thatcher’s handling of a number of key issues. Of the five issues given the balance was favourable on three:
NOP Political, Social, Economic Review Issue no.38 1982 September
Although there has also been a fall in the number of people professing themselves satisfied with Mrs Thatcher’s performance as Prime Minister, the balance is still in her favour, with 47% satisfied and 44% dissatisfied in September. Even after the slight fall since June, this is still a much better rating than Mrs Thatcher has received for the rest of her period as Prime Minister.
With the popular press clearly having such an influence it is not surprising that nearly three in four respondents agreed with the notion that trade unions have too much power in Britain today. This figure, high though it is, is still an improvement, from the unions’ point of view on the last time NOP asked the question in September 1979.
Then, perhaps with memories of the Winter of Discontent fresh in their minds, 80% agreed with the notion.
British Public Opinion Issue 05.04 1983 April
When Margaret Thatcher celebrated her 4th anniversary as Prime Minister, on May 4 she could also celebrate an achievement unparalleled in recent times: 12 months of continuous Government leads in public opinion. In May 1982, at the height of the Falklands crisis, the Conservatives had the support of 44% of electors, having been below 30% only six months earlier. After the Falklands war it was widely expected that Conservative support would subside. At first events appeared to bear out that prediction. From a peak of 48% last June, Conservative support slipped to 45% in July, 44% in August and 42% in September. Since then Conservative support has changed remarkably little. Indeed, taking MORl’s regular series of political surveys between last August and April this year, Conservative support has remained in the range of 41 to 46%. Seldom in recent times have a party’s fortunes fluctuated so little over such a period.
The great inflation: government policy in the 1970s and the impact on women (2023)
The disillusionment of the Winter of Discontent (1978/79) led to Mrs Thatcher and the Conservatives being swept to power in 1979 with promises to ‘fix’ inflation via the ‘new’ monetarist policies.
Researching the public: post-war politics, policy and polling (2023)
Looking back to the early 80s through this paper we see (apparently) a unique time in history and the sudden emergence of idealism from the difficult and divisive atmosphere of the times. The long depressive ‘70s with its very high inflation and constant strikes. The early optimism of the Wilson government gradually eroded and culminated in the winter of discontent and the election of Mrs Thatcher.
Lesson and independent research activity:
Inflation and Decimalisation
Decimalisation in Feb 1971 was blamed for inflation – see this story: Were decimalisation and metrication bad for shoppers? – AMSR
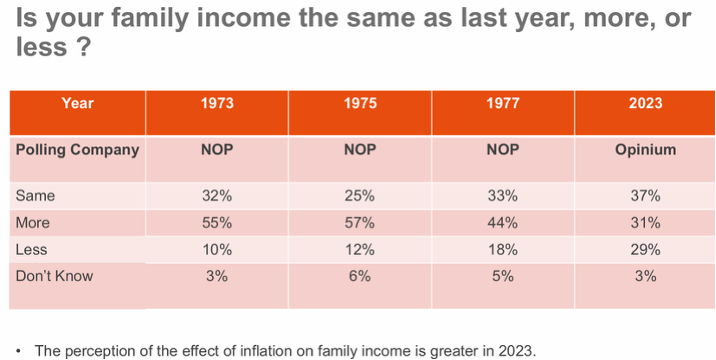
The effect of inflation in the 70’s, although much higher than recent inflation levels have been, was not so bad because wages kept up and indeed were higher than inflation, due to Govt policy, as shown in ‘The Great Inflation Article’ mentioned above. See Inflations Qs Over Time – Better Statistics CIC for an analysis/comparison of attitudes to inflation in 2023 with those of the 1970’s, you’ll see the difference.
A lot of good things happened in the 1970s…
Social welfare was important to the Labour Government – for example the Winter Fuel allowance was introduced in 1973 – see how research influenced the policy: What have we learnt about preventing hypothermia and winter mortality in the old and poor? – AMSR
The 1970’s saw the real beginning of the development of Technology: TGI: how much has technology changed since the 1970s? – AMSR . BT was privatised in 1984, and Vodafone was established around that time and mobile phones were launched – they were initially the size of bricks but…
2: The 1970 General Election
Pollsters, the Press, and Political Polling in Britain. Robert M Worcester
Polls dominated the 1970 election campaign reporting and, during the following September, The Harris Poll found 62% of the country remembered seeing polls (71% recalled seeing them on television).
Political Opinion Polling in Great Britain: Past, Present and Future. Robert M Worcester
In 1970 when the polls got it so badly wrong, they were very much in the public eye; the Conservatives were the surprise winners of the ‘sunshine’ election of 1970.
All the polls got the winning party wrong in straight poll figures, with all predictions being too Labour, but ORC adjusted its final raw figures by projected turnout to correctly predict a Tory victory.
Opinion Polls and the 1970 General Election. Frank Teer
See also: Stop Press: Final Election Survey 1970 June.
In a post-election survey of the 1970 Election, the Tories made considerable gains from those who had voted Labour in 1966, Labour lost more of their 1966 strength through abstention than did the Tories and, although younger voters are more likely to support Labour theoretically, there was substantial abstention in this group.
The Tories won support on their promise of beating the Cost of Living Situation and a pre-election NOP survey shows the problem retained its importance throughout the campaign.
The majority who thought the Conservatives were the best party to deal with this problem doubled during the 3 weeks leading up to June 18.
The Tories seemed to have fought a substantially better campaign than Labour, particularly on television.
Lesson and independent research activity:
The Liberal Party and Mr Thorpe
The growing popularity of the Liberal party between the 1970 and 1974 elections is quite startling – see this article from the Guardian in Oct 1973 headlined ‘Liberal surge jolts Heath—and Wilson’ . Here’s the data – one can see why they might be worrying!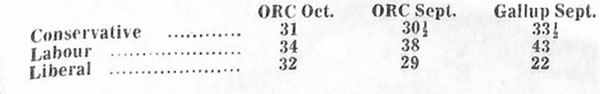 NOP Political Bulletin 1973 September – Page 24 – NOP Reports – The AMSR Online Archive
The article on the previous page is also worth a look: NOP Political Bulletin 1973 September – Page 23 – NOP Reports – The AMSR Online Archive. Here’s a chart from The Times which shows the change in the polling results 1972-1973 month by month. We have a history in the UK of third parties suddenly bursting on the scene, only to disappear – see the SDP 10 years later. They attract voters who are vaguely dissatisfied with the main parties – but generally have too broad a base of voters to be able to satisfy them all.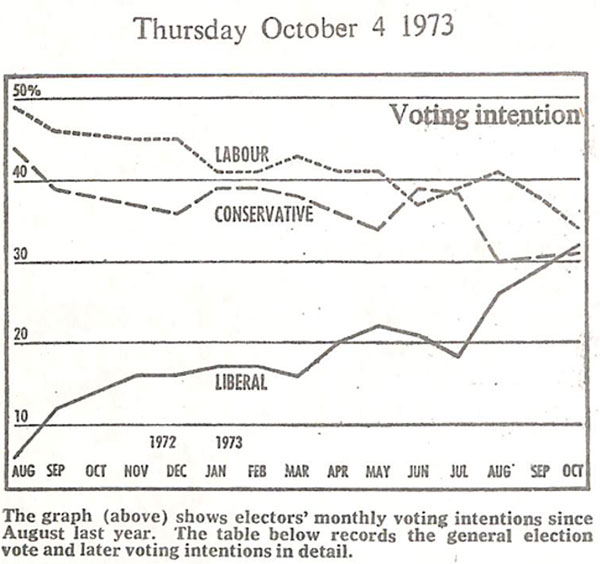
3: The 1974 General Elections (February and October)
3.1 The February 1974 General Election:
Pollsters, the Press, and Political Polling in Britain. Robert M Worcester
Political Opinion Polling in Great Britain: Past, Present and Future. Robert M Worcester
Despite the 1970 fiasco, polls were as much quoted in the Press in the February 1974 General Election as they had been in 1970, perhaps even more so on television.
Both major parties mounted substantial private polling programs and 6 polling organizations conducted major national polls for the Press.
The polls presented a confused picture: 5 polls showing a Tory lead ranging from 1.5-11% and every poll showed a trend to the Liberals.
On Election Day, the published polls were close but every prediction in February 1974 was too Conservative. The Conservatives won the popular vote by 0.8%, but Labour, with more MPs elected won the February 1974 General Election.
In the 1974 election, the difficulty of translating votes measured by the polls into seats in the House of Commons was crucial. The Conservatives won most votes but it was Labour who won the most seats. Every single prediction in June 1970 had been too Labour, every single prediction in February 1974 had been too Conservative.
Polling in Britain: A Historic Route to the Forecasting Future. Professor Robert M Worcester, MORI, traces the origins and track record of pollsters, politics and the media
Harris and NOP were the 2 polling firms employing the largest sample sizes, random sampling and re-interviewing but were the furthest adrift. All the polls overestimated the Liberals, who did not contest 106 seats, and the pollsters failed to take this into account. All the polls underestimated Labour. All but Marplan adjusted for differential turnout and this increased the Tory lead erroneously (Worcester, 1975).
NOP Political Bulletin 1974 March/April
An NOP opinion poll in March 1974 showed that most people made up their mind which party to vote for before the election campaign began, however 24% of all respondents made up their mind during the campaign itself. This figure is high, ie 1 in 4, due to deliberate oversampling of Liberal voters who tend to be late deciders, but if Liberal voters are excluded, this falls from 24% to 18% which is still high (1 in 5).
Nearly 1 in 5 Liberal voters did not decide to vote Liberal until the last few days of the campaign.
The polls over-estimate of the Liberal vote and under-estimate of the Labour vote at the General Election may have been the result of late changes from a Liberal intention to a Labour vote.
The Volatility of Voting Behaviour
This was an election marked by change in that in 1974, 3 million more voters voted, and 4 million more voted Liberal compared to 1970.
NOP Political Bulletin 1974 March/April
Another source of inaccuracy in the pre-election polls was the adjustment for differential turnout. Following the post-mortem on the 1970 election, it was decided that election prediction would benefit from adjustments for differential turnout. In 1970, there was a strong relationship between stated intention to vote and actual turnout. This was not the case at the 1974 General Election where many respondents who expressed a very low likelihood to vote before the election actually did turn out to cast their vote.
Furthermore, most experimentation on weighting for differential turnout indicated a net advantage of 1% to the Conservatives so, learning from the 1970 Election, the majority of opinion polls, including NOP, adjusted their final figures to take this into account. However, the established relationship between turnout and Conservative party advantage did not repeat itself in 1974 and these adjustments made the poll forecasts less accurate.
The 1974 General Election saw more published opinion polls than any previous British Election. However, there was no significant increase in the penetration of opinion polls compared with 1970. 58% claimed to have seen poll results during the 1974 campaign. During the 1970 campaign it was 56%. There was no indication that respondents who made up their mind about their vote after the half way stage in the campaign were any different in their exposure to opinion polls than those who made their mind up early.
Most people who had seen poll findings remembered that they showed the Conservative party ahead (58%). However, almost half the electorate (48%) had no idea what the polls were showing.
In 1970, 11% voted other than for the 2 main parties; in February 1974, it was 25%. This trend has increased since 1955 showing the difficulties in forecasting.
3.2 The October 1974 General Election:
Polling in Britain: A Historic Route to the Forecasting Future. Professor Robert M Worcester, MORI, traces the origins and track record of pollsters, politics and the media
In October 1974, Labour Prime Minister Harold Wilson was forced to call a second General Election in a bid to turn his minority in Parliament into a solid working majority. During the 3 week election, the published polls carried out some 40,000 interviews, with well over 10,000 more conducted privately.
Every poll, apart from one (NOP, 16 September), showed Labour comfortably ahead. The results were more clustered than previously, of the 25 polls published, 20 appeared on a Thursday or a Sunday, none on a Monday or Tuesday, and only one on a Friday or Saturday.
The final polls all picked the winning party, but this time the results were too pro-Labour and pro-Government.
The October 1974 election was the 4th in a row in which every single poll overestimated the support for the party that was in the lead.
NOP Political Bulletin 1974 October
The October 1974 election demonstrated that the later polls are conducted in the campaign, the more likely they are to be accurate indications of the actual electoral outcome.
The NOP poll conducted between 2-5 October 1974 indicated little change in the state of the parties during the campaign so far, the Labour lead was still about 8% but there was still a high proportion of undecided (16%) who, upon further questioning, seemed slightly more in favour of the Conservatives than Labour.
Electoral volatility seems to have increased during the 1970s, with NOP finding that 28% of all respondents sometimes change their party allegiance between Elections.
However, the actual Election result showed the Conservative party did surprisingly well, taking voters from the Liberals in key marginal seats.
4: Public Attitudes to Heath, Wilson and Thorpe
NOP Bulletin 1968 July
Mr Heath’s problems relate to personality and communication. 32% attribute his lack of popularity among Conservatives to the fact that he does not have much personality. 19% say that it is difficult to tell what he stands for. Many people seem to feel that Mr Heath does not find it easy to project himself and his policies to the electorate. And, however unfair it may seem, his bachelor status does not help.
Like Mr Heath, Mr Thorpe has a communication problem, but it is a problem of a different kind. Only half the voters know that Mr Thorpe is leader of the Liberal Party. 7% think the party is led by somebody other than Mr Thorpe, and 42% admit that they do not know who the Liberal leader is. Awareness of Mr Thorpe is greater than it was last September. But the disturbing fact remains that, 18 months after Mr Thorpe succeeded Mr Grimond, only two-thirds of Liberal voters know the name of the leader of their own party.
NOP Bulletin 1968 October
Mr Wilson’s rating is static, and now stands at 41%. The unchanged overall figures do not mask any important variations in the party breakdowns, 82% of Labour voters are satisfied with the Prime Minister; 79% of Conservatives are dissatisfied. These figures are virtually identical to those recorded in August.
Mr Heath’s rating has shown little variation since the spring, and remains extremely low. Furthermore, his popularity among Conservatives shows no sign of improving. Only 46% of Conservative voters are satisfied with Mr Heath’s leadership, while 40% are dissatisfied – and at a time when, in the eyes of the man in the street, Mr Powell is emerging as a credible alternative. In I967, Mr Heath’s popularity increased very sharply after the Party Conference, but subsequently drifted downwards. It will be interesting to see whether this pattern recurs.
Shortly before the Liberal Assembly, 46% of the electorate said they were satisfied with Mr Thorpe as Liberal Leader, while 17% were dissatisfied. Among Liberal voters, Mr Thorpe’s rating was a satisfactory 76% suggesting that Mr Thorpe is a good deal more popular among his rank-and-file than Mr Heath, though slightly less popular than Mr Wilson.
NOP Bulletin 1970 January
The popularity of Mr Wilson is still higher than that of his Government. Since June, the popularity of Mr Wilson has increased from 39% to 47%. However, there are still as many voters dissatisfied as satisfied with him. His support still rests primarily among Labour voters; 87% of the Labour voters as compared with 18% of the Conservative voters are satisfied with Mr Wilson.
Winning the Sydney—Hobart Yacht Race does not seem to have improved Mr Heath’s popularity as Leader of the Opposition. Like Mr Wilson’s, his popularity has remained stable over the past month: there is still a larger proportion of the electorate who is dissatisfied, rather than satisfied, with Mr Heath. Just as party loyalties influence the evaluation of the Prime Minister, so do they influence the evaluation of the Leader of the Opposition: 57% of the Conservative voters as compared with 28% of the Labour voters are satisfied with Mr Heath. However, only 57% of the supporters of his party are satisfied with him, while 87% of the Labour voters are satisfied with Mr Wilson.
NOP Bulletin 1973 October
Mr Heath has the support of 77% of Conservative voters who say they are satisfied with the way he is doing his job. Only 63% of Labour supporters hold that opinion about Mr Wilson.
Satisfaction with Mr Wilson’s performance as Leader of the Opposition is again down to the low point measured in August 1973. However, 1 elector in 5 had no opinion about Mr Wilson’s performance. Consequently, fewer electors were dissatisfied with Mr Wilson.
There has been much speculation recently, by journalists and politicians about the extent of political disillusionment amongst the electorate. In an attempt to examine this concept we have combined electors’ answers to the 3 questions about the Government, Mr Heath, and Mr Wilson. One elector in 10 (9%) claimed to be satisfied with the Government and Mr Heath and Mr Wilson (see Table). However, twice as many (20%) said they were dissatisfied with all 3.14% were satisfied with the Government and Mr Heath but dissatisfied with Mr Wilson, while 19% were dissatisfied with the government and Heath but satisfied with Wilson. A further 5% have no opinion on all 3 questions.
Lesson and independent research activity:
The period between the two elections in 1974 is obviously of key interest to the Opinion Pollsters. Here’s a view from the Economist on August 10, 1974 – headlined: ‘Will they love him in October as they loved him in July?’ (referring to Mr Wilson). It gives an interesting view of the public’s opinion of the parties. NOP Political Bulletin 1974 July – Page 16 – NOP Reports – The AMSR Online Archive. Here’s an extract:
‘But if Labour’s lead did briefly vanish in mid-July (perhaps as a result of Mr Wilson’s rude rebuff to Mr Thorpe’s coalition initiative, since those who answer pollsters’ questions are notoriously coalition-minded), the difficulties the Tories face in trying to shake Mr Wilson’s apparent hold over the electorate were underlined by a further ORC poll in The Times on Monday. When asked to recall things the Government had done, 43% of those questioned mentioned increased pensions, 26% getting the miners back to work, 19% “trying to keep food prices down” and 13% freezing rents. By contrast, the strongest unfavourable reaction came from only 9%, who said that the Government had “made a mess of everything”’
So it’s clear that quite a lot has been going on! But remember people sometimes say different things to Polls than they do in the actual election…
Here are some interesting results on attitudes to Tactical voting taken just before the October Election: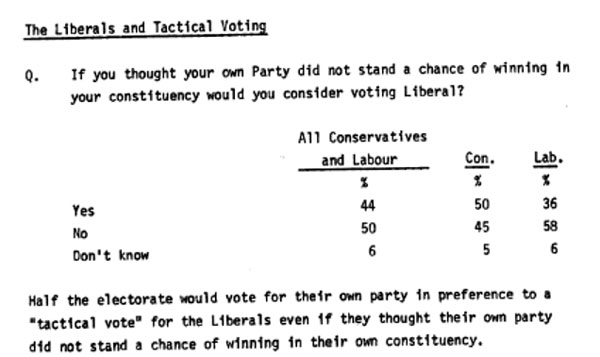 NOP Political Bulletin 1974 October – Page 6 – NOP Reports – The AMSR Online Archive
If you really want to look at what was going on in the run up to the 1974 elections then these are probably your 2 best sources. The rise of Jeremy Thorpe is astonishing – he was nowhere in May 1973 (see page 6 of first link)- but very highly rated by Oct 1974.
NOP Political Bulletin: a Special Report on Public Opinion, April 1973 – August 1973, for the Office of Population Censuses and Surveys – Page 1 – NOP Reports – The AMSR Online Archive
NOP Political Bulletin: a Special Report on Public Opinion, September 1973 – December 1973, for the Office of Population Censuses and Surveys – Page 1 – NOP Reports – The AMSR Online Archive
Thatcher and the 1980s
Focus on the impact of Thatcher’s policies in the 1980s, welfare, and foreign policy. Assess the reasons why Britain’s membership of the EEC/EU was such a controversial political issue during the period from 1979 to 1997.
1: Mrs. Thatcher – Welfare and Foreign Policy
British Public Opinion Issue 05.10 1983 November/December
Mrs Thatcher’s pro-USA foreign policy allowed UK sites to be used for USA weapons. ‘Cruise and The Day After’ assesses public opinion as Cruise missiles begin arriving in the UK.
British Public Opinion Issue 06.03 1984 March
It would appear that the succession of “banana skins” of the past few months have taken their toll on Mrs Thatcher’s reputation. Since last December her rating has declined by 8 points, while the government’s has actually improved by 3 points.
Throughout this period the other party leaders have all had clear positive ratings. In March their ratings were: Kinnock +17%, Steel +32%, Owen +14%. A part of the explanation for the decline in the Prime Minister’s standing is to be found in responses to a specific set of questions MORI asked about her performance.
Although she scores high marks for her handling of economic and foreign policy issues, she does badly on a number of the “banana skin” issues. Substantial majorities think she has done a bad job handling the controversies over Government’s Communications Headquarters/ union membership.
NOP Political, Social, Economic Review Issue no.48 1984 June (Incomplete)
NOP have conducted a number of polls on the subject of the Falklands and on the public’s attitude towards the “Fortress Falklands” policy in particular. At the time of the conflict itself, most people agreed with the government that Britain should retain control of the Islands and should not negotiate over sovereignty with Argentina – 56% said that Britain should hold onto the islands indefinitely compared with just 36% who wanted negotiations. Subsequent polls have indicated, however, that the Government’s uncompromisingly hard-line “Fortress Falklands” policy is becoming increasingly unpopular with the British public – in January 1983 54% were in favour of negotiations with Argentina while only 36% were against and by November 1983 the number in favour had increased to 63%.The latest poll to be conducted by NOP maintains this trend with two in three people now wanting negotiations to take place. This poll was conducted for the Mail on Sunday on 6th April 1984 amongst a representative quota sample of 1015 adults in 53 constituencies across Great Britain.
When those who favoured negotiations with Argentina were asked which of three possible options they preferred for the future of the Islands, just over half said that they would like there to be a joint arrangement between Britain and Argentina to run the Islands, The alternative of putting the islands under the control of the United Nations was also quite popular, being chosen by one in three, leaving just one in ten who thought that a date should be set for Argentina to take over the ownership of the Islands.
Although attitudes on the question of sovereignty have changed over the last two years, the British public is still strong in its conviction that we were right to send the task force to recapture the Falkland Islands. Seven in ten said they were in favour of sending the task force at the time of the Argentina invasion and very few have decided in retrospect that this was the wrong decision.
British Public Opinion Issue 06.09 1984 October
October 7: Harris poll finds that 59% think unemployment and other benefits are not adequate for people to live on and should be increased; but 65% of those in work (including 58% of those who think benefits are inadequate) are not prepared to pay more in taxes in order that benefits be increased.
NOP Political, Social, Economic Review Issue no.56 1985 December
One in four of those who voted Conservative in 1983 had by the summer of this year defected, nearly all to the SDP/Liberal Alliance. This is one of the findings from a special NOP survey of Conservative voters, carried out in July on behalf of the Daily Mail, which involved interviews with 982 people who said they had voted Conservative in the 1983 General Election.
Those who were no longer sure of voting Conservative were asked why they had stopped supporting the government. A very wide variety of answers was given, the single most common being unemployment (26%). Generally speaking specific policy areas were the most often mentioned, with 8% saying the NHS, 7% education, and 20% other specific policy areas. There was also some general dissatisfaction – 14% said the Conservatives hadn’t fulfilled their promises, and 11% that they were generally disappointed. Complaints about Mrs Thatcher herself were less common, although 8% said she was too stubborn and 6% that they had become disillusioned with her.
Switchers were asked directly whether they had changed their vote mainly because of disagreement over policies or mainly because they didn’t like Mrs Thatcher as leader – 63% said policies, 8% Mrs Thatcher, 15% both equally and 12% neither.
Those who said ‘policies’ were asked which ones in particular they disagreed with. Two in 3 said unemployment, half each the NHS and education, and around a third the welfare state and the running of the country. They were also asked if they disagreed with these policies in principle, or if they, or a friend or relative had suffered as a result of them. One in 4 said the latter and a further 15% said both equally.
British Public Opinion Issue 08.06 1986 June
June 23: Marplan poll among 1,032 people who recall voting Conservative at the last general election finds that 57% think public spending should increase, even if this means raising taxes. 13% think taxes should be cut, even if this meant less money for government services such as education, health and welfare, while 26% think things should be left as they are.
British Public Opinion Issue 11.05 1989 June
This link will take you to a variety of polls (Harris, Gallup, MORI) reviewing Mrs Thatcher’s 10 years as Prime Minister and assessing the best and worst Tory policies.
For example:
April 30: MORI: Survey conducted for BBC TV's On The Record programme finds that 17% nominate the curbing of union power as one of the three best things the Conservative Government has done since 1979, followed by 9% mentioning tax cuts, 7% reducing inflation, and 7% privatisation. Asked about the worst things done by the Government, 35% nominate NHS cut-backs, 19% the Poll Tax, 18% privatisation, and 15% unemployment. Fieldwork 12-13 April 1989, sample: 1,110. [Sunday Times].
Lesson and independent research activity:
The Growth of the Social Democratic Party
The rise of the SDP was an interesting phenomenon at the time – and something we can learn from, given our two-party, first-past-the-post system. This is based on qualitative research undertaken by one of the leading qualitative researchers of the time, Peter Cooper:
The Fluctuating Fortunes of the U.K. Social Democratic Party (paper originally presented at 83rd ESOMAR (European Society for Opinion and Marketing Research) Conference, Barcelona 1983) – Page 2 – The CRAM Peter Cooper Collection – The AMSR Online Archive
See also this essay for a broader view of the Other Political parties: Researching the others: outside the two-party system – Page 3 – Research History – The AMSR Online Archive
2: EEC/EU Membership
NOP Political Bulletin 1973 October
Approval of Britain’s membership of the EEC has continued to fall; only one third of electors now approve. This is 10% fewer than when we first joined in January.
The drop in support for British membership has been mainly among Conservative supporters. Only half of them now approve compared with 59% in June. The reasons for this growing dislike of British membership become clearer when one examines the things that electors think cause inflation. Half of the electorate blame the Common Market for rising prices and inflation.
A quarter of the electorate chose the British membership of the EEC as the most important cause of rising prices. This may well explain why support for British membership is declining.
Political, Social, Economic Review 1982 February
The EEC proved to split respondents, exactly as it had done in a previous poll in October. Altogether 45% favoured immediate withdrawal and 44% opposed it, but the difference between these two figures is certainly not statistically significant. Conservatives were strongly against withdrawal. Labour voters strongly in favour and Alliance supporters were equally split.
Respondents then are divided as to whether we should leave the EEC, but they were in no doubt that there should be a referendum before any decision was taken. Two in three wanted a referendum and although current Labour policy is to leave without a referendum. Labour voters were the strongest supporters of the referendum (78%).
British Public Opinion Issue 06.05 1984 May
May 29: Gallup poll conducted throughout the Common Market finds that one in four EEC citizens wants Britain out of the Common Market. The proportions in each country wanting Britain out are: France 41%, Luxembourg 38%, West Germany 33%, Greece 27%, Netherlands 23%, Belgium 20%, Italy 18%, Denmark 15% and Ireland 14% (Guardian).
British Public Opinion Issue 10.08 1988 October
EUROPE September 25: NOP: Forty-three per cent of adults think Britain would have a greater say in world affairs by maintaining its “special relationship” with the United States, while 47% think closer links with Europe would increase its influence. 59% agree that European countries in NATO should devote more resources to defence rather than relying on the US, while 31% disagree. 31% believe Mrs Thatcher’s speeches against a “United States of Europe” will leave Britain isolated in the EEC, while 52% think she was acting in Britain’s best interests. 47% agree with the principle of a common European currency, while 48% disagree. 25% agree that more decision making power than at present should be given to the European Parliament rather than Westminster while 67% disagree. Fieldwork: 23 September 1988, sample: 1,043. [Mail On Sunday].
British Public Opinion Issue 11.06 1989 July/August
EUROPEAN COMMUNITY June 16: Gallup: Fifty-five per cent regard Britain's membership of the EC as a good thing, 18% a bad thing, and 23% neither good nor bad. 58% think protection of the environment is a matter to be decided within the Community, while 38% think it is a matter for the British Government. 62% think their children will feel more a part of Europe, and 3% less a part, than they do. Fieldwork: 12-21 May 1989, sample-1,274. [The Times]
British Public Opinion Issue 13.10 1990 November
Geoffrey Howe’s resignation on 1 November marked two things: it was the latest in a difficult, not to say accident-prone, month for the Conservatives, and particularly for Mrs Thatcher; and it was the third major casualty in the Cabinet over the issue of Europe in twelve months. First there was Nigel Lawson this time last year, then Nicholas Ridley and now Sir Geoffrey Howe, the last surviving member of Thatcher’s original 1979 cabinet. Her strong stance against further European Union at the Rome summit on 28th October has lost her a respected and long-standing colleague.
A survey of backbenchers conducted for On The Record by On-line Telephone Surveys, a subsidiary of MORI, found that even amongst Conservative MPs, support for a single European currency, and the expectation that such a currency will become a reality within a decade, are higher than Thatcher might have expected.
Lesson and independent research activity:
EEC/EU Membership
Read this summary about how we felt historically about Europe: Have we always been unsure about Europe? – AMSR
The Abolition of the GLC
Mrs Thatcher’s Abolition of the GLC in 1986 was an unpopular move for Londoners, who voted against it, but she did it anyway. See AMSR Newsletter 2024 July – Page 12 – Miscellaneous Newsletters – The AMSR Online Archive .
The Decline of the Conservative Government (1990s)
Assess the reasons for Margaret Thatcher’s downfall in 1990. Analyze the decline of the Conservative government and the rise of New Labour under Tony Blair.
1: Decline of Conservative Government and Reasons for Mrs Thatcher’s Downfall
British Public Opinion Issue 11.05 1989 June
Page 12 summarises a variety of polls taken on Mrs Thatcher’s 10th anniversary covering a wide variety of policy issues such as council house ownership, Falklands, Poll tax, changes in British temperament, welfare and economy. Although there are still positive comments, there are clearly signs of dissatisfaction. For example: Asked what is the most annoying thing about Mrs Thatcher, 24% say her voice, 19% uncaring nature, 15% obstinacy, and 12% policies. Fieldwork: 19-20 April 1989, sample: 1,040. [Observer]. Asked about the worst things done by the Government, 35% nominate NHS cut-backs, 19% the Poll Tax, 18% privatisation, and 15% unemployment. Fieldwork 12-13 April 1989, sample: 1,110. [Sunday Times]. Over the past ten years, 84% think people have become more aggressive, while 10% think people have become less aggressive. For other attributes: More selfish 78%.
Lesson and independent research activity:
Mrs. Thatcher’s Legacy
It’s worth looking at the outcome of some of Mrs Thatcher’s legacy : What happened to Margaret Thatcher’s dream of a share-owning public? – AMSR
Also if you want to look at something a little more light-hearted read : Brands as people, People as brands – A study of political brand values – Page 2 – The CRAM Peter Cooper Collection – The AMSR Online Archive. It’s from 1989 and you will see how people saw Mrs Thatcher towards the end of her tenure as PM. It might also be fun to repeat the research on today’s leaders – with your school colleagues – it could even be part of an interesting EPQ? Here’s an extract:
‘Using some of Respondents’ own comparisons, Mrs. Thatcher is like “a Tank”, or “a Land Rover”, a “Range Rover” or a “Batmobile” – she would drive right up the middle of the road, dominate, lean towards the showy/flashy makes, and cope with the rough ground. As an animal she was seen as a ”Rottweiller” or “Doberman”, a “Lion” or “Tiger”, even an “Elephant” (it goes on a long time and doesn’t forget). But if you were in real trouble you’d trust her – if there was “an enemy”. She is like an iron bar, but also like a brick you can’t get through. If she was a Doctor you’d go to her, but she’d be expensive. You have to “pay”, give up the “caring” part of yourself, she would be harsh, stern, efficient, thorough and show little pity. She is like “dry sherry” or “whisky sour” or a “Scotch and water” (looks harmless but packs a punch).’
2: Rise of New Labour under Tony Blair
1997 General Election: Post-Election Recall Page 4. British Public Opinion Issue 20.05 1997 July
Summarises voter key reasons for voting the way they did in the 1997 general election. The reasons cited for those who voted Labour are as follows:
- “Things were getting so bad with the Conservatives that I decided to give the Labour party a try”
- “It was time for a change”
- “One of Blair’s speeches on television at the last minute. His general view …. it was for everyone rather than the elite few”
- “I voted Labour because, to be honest, I like Tony Blair – you know, he makes sense, doesn’t he – in the end it was the best choice”
- “I saw an interview of Tony Blair on TV and I liked some of the things he said and the country was heading the wrong way anyway with the current party. What he said swung my vote towards the Labour Party”
- “Well I just thought that they deserved a chance”
- “I would like to have voted Liberal but they had no chance in this constituency. I voted Labour to be sure of getting rid of the Conservatives.”
- “Television and newspapers swayed me”
- “I lost faith in the Conservative Party – I thought it was time for a change.”
- “Fed up With the long Tory reign”
- “I wanted to get the Conservatives out and at the time I spoke to you previously I was undecided between Lib Dems and Labour.”
- “They were the best of a bad bunch”
- “No other party sent me any literature except for the Labour Party so I voted for them.”
British Public Opinion Issue 21.02 1998 March
With the election anniversary approaching, most observers would agree that Tony Blair has had a successful first year in office. With the exception of a short blip during the summer, his new Government has enjoyed an extended honeymoon period, and – with the celebrations now over – Labour continues to hold a powerful lead over the Conservatives. For Mr Blair, perhaps the most encouraging aspect of the current voting intention numbers is that Labour is achieving polling figures which are in line with those it was recording at the height of its pre-election popularity in 1995-96. MORI’s March 1998 poll for The Times puts Labour on 53%, with the Conservatives on 28% and the Liberal Democrats on 14%. Labour’s current party support figures exceed – though only just – the highest level of support achieved by the Conservatives during the 1979-97 parliaments, the 50% share recorded in August 1988.
The government and Tony Blair himself remain popular; the majority think that the recent budget will be good for the country and that government economic policies will benefit the economy; even the mostly-Tory owner-managers of medium-sized businesses admit by a wide plurality that the Prime Minister is doing a good job running the country.
British Public Opinion Issue 21.03 1998 April
Party switching in Blair’s first year. 26 April: ICM: One in three voters has switched party allegiance since election day last year, according to a panel study for the Observer. Labour has benefited most, gaining around five million new supporters, but one in five who voted Labour in 1997 would not do so today. The switch to Labour has been predominantly among the middle class, with Labour support among ABCls rising from 38% to 49%, but among C2DEs the rise was only from 53% to 56%. Fully half (51%) of those who voted Conservative agree that Labour’s policies have been good for the country. Sample: Panel of 1,000 electors from c.2,000 originally interviewed on 1-3 May 1997, re-interviewed by telephone 20-22 April 1998. [Observer]
Lesson and independent research activity:
The Rise of New Labour under Tony Blair
Already in 1994 we can see the very positive public perception of Tony Blair: British Public Opinion Issue 17.05 1994 June/July – Page 4 – MORI British Public Opinion – The AMSR Online Archive.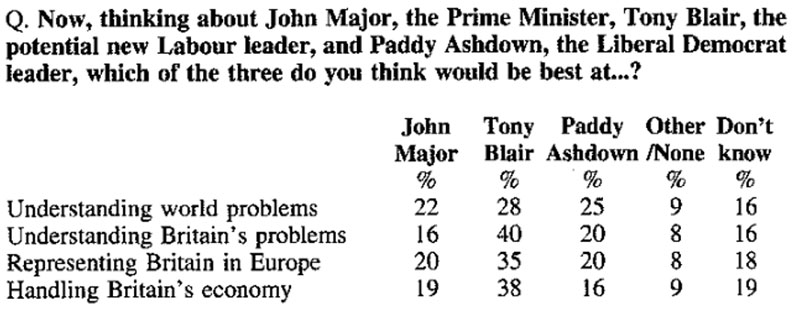
The 1997 General Election and New Labour
Examine the significance of the 1997 general election and the policies of the New Labour Party.
1: The 1997 UK General Election
British Public Opinion Issue 20.03/4 1997 April/June
How Britain voted. A detailed overview of the polls conducted for the 1997 general election. MORI’s 1997 General Election voting aggregate is compiled from interviews (conducted face-to-face and in-home) with 13,544 British adults during the election campaign (21 March-29 April 1997). Data were weighted to match the profile of the population and the final result of the election at regional level. The figures exclude those who said they would not vote (7%), were undecided (9%) or refused to name a party (3%).
Research Magazine issue 374 1997 July Sparrow Call for Poll Probe. Noelle McElhatton
Following the 1997 General Election, Nick Sparrow, MD of ICM, one of the UK’s five leading political polling companies, called on his fellow pollsters to ‘properly investigate’ the different methodologies used by pollsters in 1997’s General Election.
Despite favourable media coverage of the polls’ performance, ‘we should avoid the temptation to bask in the perceived glory of success and learn from the experience’. He points out that most polls carried out during the six week election campaign ‘continued to display the same extent of pro-Labour bias apparent in 1992’.
Did the Campaign Count? Research Magazine issue 390 1998 November
An overview of various publications analysing the 1997 election campaign and the ‘New Labour’ project based on US Democrat style campaigning. Fuller data show 3 million defectors from Tories to Labour or Lib Dem who have to be won back.
Letter to Our Readers. British Public Opinion Issue 22.06 1999 August
In 1997, ‘New Labour’ won a landslide victory at the general election after 18 years of Conservative government under the leadership of Tony Blair.
Despite the length of the campaign (6 weeks) and the eventual (predicted) low turnout, fewer people thought that there was too much media coverage than in either 1987 or 1992. In fact,1987 was thought by more people to have too much about the election in the newspapers and on TV than either of the successive elections, both of which were characterised as “the most boring election since the war”.
There was a view that Labour’s use of private opinion polls and especially focus groups was a new “Americanisation” of British politics. In fact there was little new in Labour’s private polling that was not being done in Labour’s private polls in the 1970s, when MORI was Labour’s pollster; what was different was that for the first time the polling information was used effectively by the party leadership.
The Tories employed negative advertising, such as the “demon eyes” poster, but the public dislikes negative campaigning, and although it can sometimes work, this was not the case with “New Labour, New Danger”, which seems to have been entirely counter-productive: nearly 4 times as many electors said that the “demon eyes” campaign made them more likely to vote Labour as said it made them less likely to do so.
There was a view that the opinion polls got the election wrong. However, the ‘poll of polls’ predicted the Tory share of the vote to the nearest whole number, and was within the standard margin of error for the other parties. Furthermore, polling in Scotland and constituency polls was extremely accurate. The polling companies had solved the problems which beset their ‘predictions’ in 1992. Polling is not a crystal ball that can offer predictions of supernatural accuracy, being subject both to the limits of statistical sampling and the behaviour of the British voter that is sometimes unpredictable even to the voter himself or herself. However, even with these necessary reservations, it remains a better guide to the political climate than any of the less scientific alternatives.
Conversely, the pundits got the election wrong in most cases. Of the 20 pundits on the Reuters panel of so-called political experts, the average eve-of- poll forecast was a Labour majority of 92, just over half of the 179 majority on the day, and compares to the average 159 seat projection recorded by the opinion polls. Not one of the 20 pundits was as close to the Tory share of the vote as the opinion polls’ average.
2: The Policies of the New Labour Party
MRS Conference Papers Annual Conference 1998 (part 1, pp 1-147 plus a paper revision inserted after p 84)
In May 1994, the political world was thrown into turmoil by the premature death of John Smith, the popular new Leader of the Opposition. Smith’s cautious approach was replaced by Tony Blair’s passion for his project: reinventing Labour in the mainstream, with particular focus on the troublesome Cl C2 floating voters identified by psephologists as the battleground in the forthcoming elections. Heeding the Fabian tract, one of Blair’s first dramatic moves was to reform Clause 4. Working closely with market research consultants as key members of his strategy building unit, Blair set about creating “New Labour”. Vital to the task was the continuous stream of qualitative and quantitative data, enabling the New Labour team to refine their message to the electorate, resulting in the modernising Britain theme underpinned by five specific pledges including promises on health, and education. The landslide victory on May 1 seemed to speak for itself.
The early weeks of the new government were characterised by extraordinary verve and vigour. No time was lost in effecting change as initiative followed initiative, first in the ambitious Queen’s Speech, then in the unexpected emergency budget. The Prime Minister, with his fresh approach and clarity of communication was the personification of this new era.
The groups saw New Labour as breaking the dominant codes of the Tory business world with its traditional cycle of:
- Money
- Power
- Authority
- Sleaze
New Labour is beginning to tap much more into the world of contemporary business, led by consumerism. Epitomised by:
- Treating voters as customers
- All about keeping ‘our’ custom
- Using the language and tools of marketing, eg.focus groups
- Selecting the policies that we want/ close to our heart/ easy hits ie. the tempting brands/ products to entice us in
- Attracting us via a simple and appealing brand image of Tony Blair as the charismatic chairman
A key policy commitment of the new government was its ‘Welfare to Work’ programme. The New Deal for young, unemployed people was one of the Labour Party’s ‘pledges’ at the time of the 1997 General Election. The ‘pledge’ was to ‘get 250,000 under 25-year-olds off benefit and into work by using money from a windfall levy on the privatised utilities.
British Public Opinion Issue 21.02 1998 March
The Labour Party is rightly proud of its role in founding the National Health Service half a century ago, and in recent years its commitment to maintaining and improving the Service has been its flagship electoral policy. But our survey for BBC Regional Broadcasting (see p.3-4), to mark fifty years of the NHS, has found Labour (despite still riding high in almost all other polling measures) with its lowest rating as best party on health care policies since Margaret Thatcher was first elected. Only a third of the British public (33%) chose Labour as having the best policies on healthcare, down from 47% at the time of the general election and from a peak of 63% in October 1995. Admittedly, there is no comfort for the other parties either: the Conservatives scored 13% and the Liberal Democrats just 11%. But 42% now say they ‘don’t know’ or that ‘no party’ has the best policies on healthcare. This should be worrying for Labour, that the policy area which for years has been their most cast-iron vote winner no longer promotes public enthusiasm for the party.
All the overall poll figures make it clear that Britain is still giving Tony Blair and his government the benefit of the doubt, and the lack of any effective opposition from the Tories makes it easier to do that. But can it last? Many of their policies are already risking alienating their natural constituency. The trade unions express dismay at the limited implementation of new union rights. Teachers seem unhappy with the direction of educational policy. The voters doubt that welfare-to-work reforms in the budget will really get the unemployed into jobs (See p 6). All of these are important policy areas. But none has the resonance of the National Health Service.
British Public Opinion Issue 21.10 1998 December
Half the public think the Government has done a good job since the election in managing the economy, with fewer than three in ten thinking it has done a bad job, a MORI survey for The Times has found, despite continuing public pessimism about the future economic condition of the country. (The Economic Optimism Index for November though sharply up on last month, is still very low at -31.) More agree than disagree (by 46% to 33%) that in the long term the government’s policies will improve the state of the economy.
British Public Opinion Issue 24.03 2001 June
On 7 June 2001, the general election returned the Labour party under Tony Blair to power in a landslide victory thereby securing a second consecutive term with a 167- seat majority. Labour won 412 seats, while the Conservatives won 166 and the Liberal Democrats 52. Turnout was low at 59%. In anticipation of this outcome, a poll gauged the popularity of some of the policies that a new Labour government might carry out (%Support/ %Oppose/ %Don’t Know):
- Bring railways back into public ownership (72/19/10)
- Have more NHS patients treated in private hospitals (69/25/6)
- Require companies to give fathers paid time off work after their children are born (67/29/4)
- Ban fox hunting (57/31/11)
- Increase income tax to 50% for highest earners (57/33/9)
- Let secondary schools select pupils who are good at certain subjects (45/43/12)
- Put up to £800 of taxpayers’ money into an account for every new born child. They would be able to spend this money as they like when they are 18 (38/53/9)
- Join the European Single Currency (27/58/15)
- Allow private companies to run state schools (23/62/14)
Polls on Iraq, 2001-2010
ICM/Guardian March 2002 1,001 adults aged 18+ by telephone on 15-17th March, 2002ICM asked respondents whether they approved of Britain backing military action against Iraq. Just over one-third of all respondents approved compared with half who disapproved. Interestingly, small majorities of both Labour and Conservative supporters disapproved of British backing.
ICM/Mirror interviewed 1,001 adults between 27-29 August 2002. This survey provided a comprehensive review of opinion that reflected both on the year since 11 September and the current preoccupation with Iraq. Only 17% thought the war on terrorism launched by President Bush after the September 11 attacks had been a success, compared with 31% who thought it had been a failure (41% thought it was neither). Based on what they knew, 41% thought an attack on Iraq aimed at removing Saddam Hussein was justified but only if the United Nations agreed, compared with 35% who thought it was not justified (12% thought an attack was justified even if the UN did not agree).
Some 71% thought Britain should not be part of the invasion force if President Bush launched an attack on Iraq without UN backing. Whereas 75% of respondents thought Saddam Hussein was a threat to world peace today, 51% thought the same of President Bush. Since 11 September, 13% said their opinion of George Bush had gone up, whereas 32% said it had gone down (52% said their opinion had stayed the same). Whilst 45% thought Tony Blair considers George Bush’s plans and tries to be supportive whenever possible, 38% thought he was “a poodle who follows along with almost anything George Bush decides”.
These findings made grim reading for Mr Blair but Iain Duncan Smith’s robust call for support of American policy at the end of August also appeared to be seriously at odds with the view of two out of three Conservative supporters who thought Britain should not join an attack on Iraq without UN approval.
Lesson and independent research activity:
Two significant policies of New Labour were Scottish Devolution and the Reform of the National Health Service Activities around the policies of the New Labour Party – How did they do?
Scotland – Devolution or Divorce? ‘In May 1999, fulfilling a manifesto promise of the Labour government elected in Britain two years previously, a Scottish Parliament was elected for the first time in nearly three centuries’. WAPOR 52nd Conference (Paris, France), September 1999. Conference papers – Page 124 – Conference Papers other than Market Research Society – The AMSR Online Archive
Tony Blair’s legacy for the UK’s National Health Service
‘10 years of New Labour health reforms have injected badly needed funds into the UK’s National Health Service. But through repeated restructuring and micromanagement, Blair’s government seems also to have eroded clinicians’ flexibility to care for patients’. This was written in The Lancet 2007. The chart below shows how satisfaction with the NHS increased steadily and significantly from 1997 – 2007 and remained high until 2019.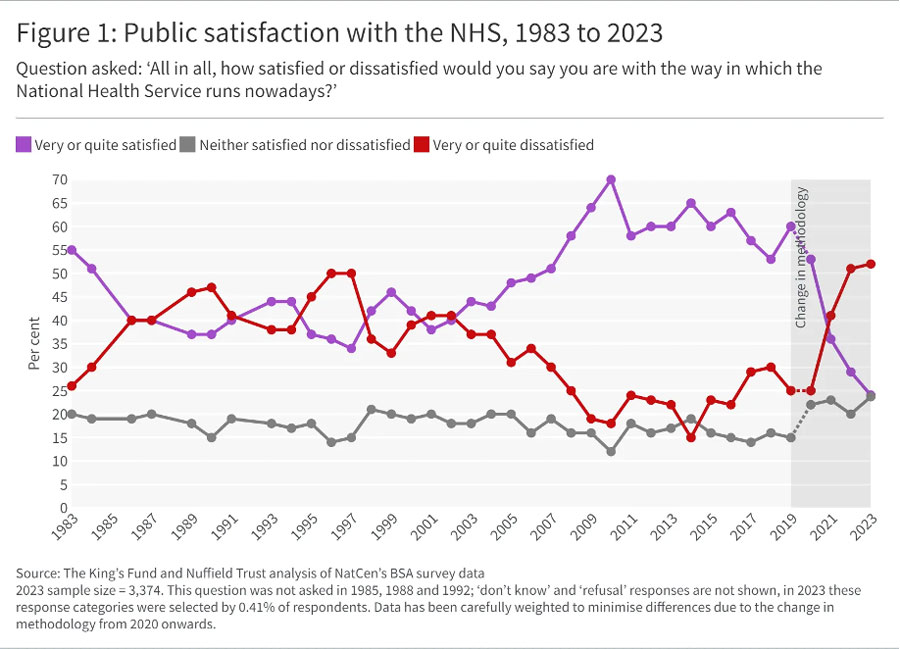
This story demonstrates the phenomenon well: The NHS: How have attitudes and expectations changed? – AMSR
These key areas are essential for students to prepare for the OCR Y113 A-level History exam, ensuring a comprehensive understanding of the historical periods and themes covered in the syllabus.
The Archive has a myriad of contemporary research, including opinion polls, surveys on immigration and of immigrants, attitudes to social change such as divorce, abortion, capital and corporal punishment, the financial equality act, attitudes to Mrs Thatcher throughout her tenure as Prime Minister… and lots more. It’s a mine of contemporary material suitable for A-level students.
Please contact us if you have any specific areas that we could help with – we have other reports on political issues, women and young people’s issues, music, marketing and so much more, all of which are useful for your dissertations, coursework and independent studies.
ACCESS THE ARCHIVE
![]()