

Alex Tan
With experience in both the academic and commercial worlds, Alex Tan has previously worked to bring the theoretical and practical aspects of doing research to clients as a freelance researcher. Alex has also done voluntary research and support work such as for the AMSR, community research, and on British Chinese experiences since concluding his doctoral work. Currently Alex works in the third sector using his people and research management skills to improve how local people and communities are supported.
Later this year (2026) the representation of the people bill will enter parliament. One part of this piece of proposed legislation is the extension of the vote to those 16 and 17 years old. It is said this will allow young people to have more of a direct say in how decisions are made about them in the UK.
The Archive of Social and Market Research has some useful sources for exploration of the issues around younger voters, currently the starting registration age is 18. Naturally there have been changes to eligibility over the years, principally the allowance of public voting itself (full suffrage for men aged 21+ was only introduced in 1918), and later the addition of women (1928), being major changes. It is only relatively recently (from 1970) in the nation’s history that we see the current set-up where all British nationals of 18 and over are eligible to register to vote.
There are further complications though, eligibility does not mean registration and then committing to vote in an election when held. Again, the AMSR can help with useful sources that have explored this phenomenon as well, indeed a core reason for the difficulty in predicting election results is that we don’t always know who will or will not turn out on the day.
To return to the original concept of newly eligible young voters, the question might very well be around how impactful it will be to future elections and what political parties and those attempting to understand and influence the vote will do about it.
Challenges around the question – young people and voting
Before looking at the sources within the AMSR it is worth taking a moment to note that voting in the UK is by definition a secret ballot, that is whether postal or in-person, electors are meant to have the privacy to give their preference without others knowing their decision. This key principle has been in place to ensure that intimidation is reduced and therefore the elected party is chosen freely and fairly.
When it comes to who has voted then it is impossible to know for sure, because we do not have figures based on who cast the ballot itself. If we want to know the rate at which younger members of society intend to and do vote it is based on self-reported estimates.
Other questions also emerge around how to define ‘young people’ and whether they should further be broken down by gender, ethnicity, or other demographic indicators. Indeed over time these groupings have been used to try to better understand and influence voters; this process being termed the creation of ‘voting blocs’.
Typically young people are defined as those under 40, possibly 35 and under. The definition can change, but as we will see within the polls in the AMSR, the groupings are defined within each poll.
It is also worth considering the definition of participation itself. Whilst we will see that younger voters are less likely to be certain of their intent to vote, and also decide less definitively when asked which party to choose, there are many ways to participate in political life which are not connected to voting. This might be membership of a political party and the potential activities that entails such as campaigning, attending meetings etc. It might also relate to other forms of social issues, which are not linked to a specific party and carry on regardless of who wins elections. Therefore being interested in politics and being active in society are not limited by voting intention or the decision made on the day.
The geographical question is also worthy of consideration, in that we have a nation comprised of four parts – England, Wales, Scotland, and Northern Ireland. Each has their own parliament or assembly with different powers and responsibilities; these sit alongside the national voting creating a complex and multi-layered system.
Local and national government are also different systems with some areas having mayoralties that can be voted for, eg. Manchester, London, and others not. The rules for these elections also differ with some areas allowing the transferrable voting format, whilst others do not. There is regular discussion about how elements of elections should be changed, with constituency boundaries altering and new formations being created. Currently (Q1 2026) we are in the middle of a process which will see many council areas change their boundaries and new larger units of governance created.
What does the Archive say about young people and voting?
If you are interested in the history of polling and public opinion, then the archive contains a useful source from 1939. In this source the British Institute of Public Opinion outlines early thinking on how to survey the public, with many considerations such as bias and accuracy being concerns today.
The archive shows that by the 1970s in The Harris Poll young people were a concern in terms of how and when they might vote.
In the extracted table below (see page 3) people were asked ‘how certain is it that you will go and vote at all?’
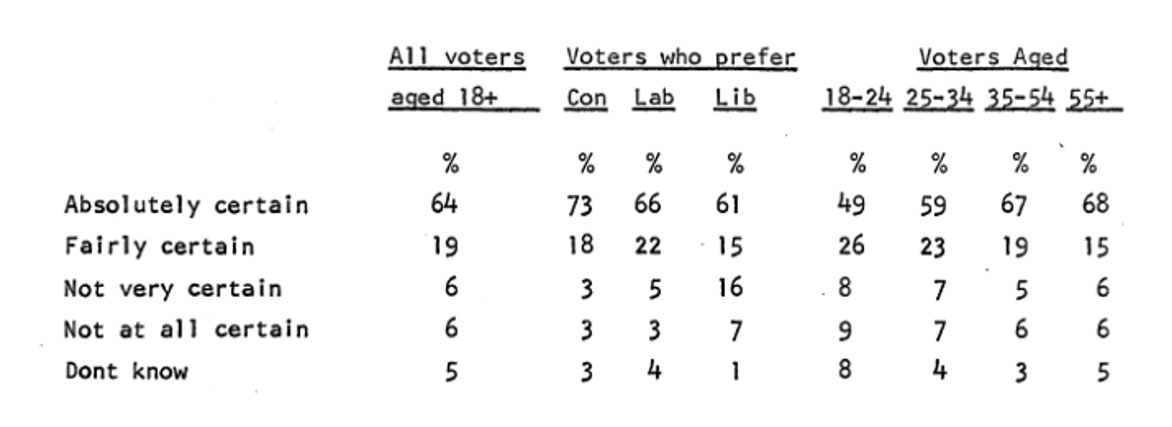
The results showed that young people were less likely to be ‘absolutely certain’ they would go out to vote when compared to older voters. The pattern grows stronger with age. This poll was important to note because the next general election (in 1970) was going to see the entrance of 18 year olds to the vote.
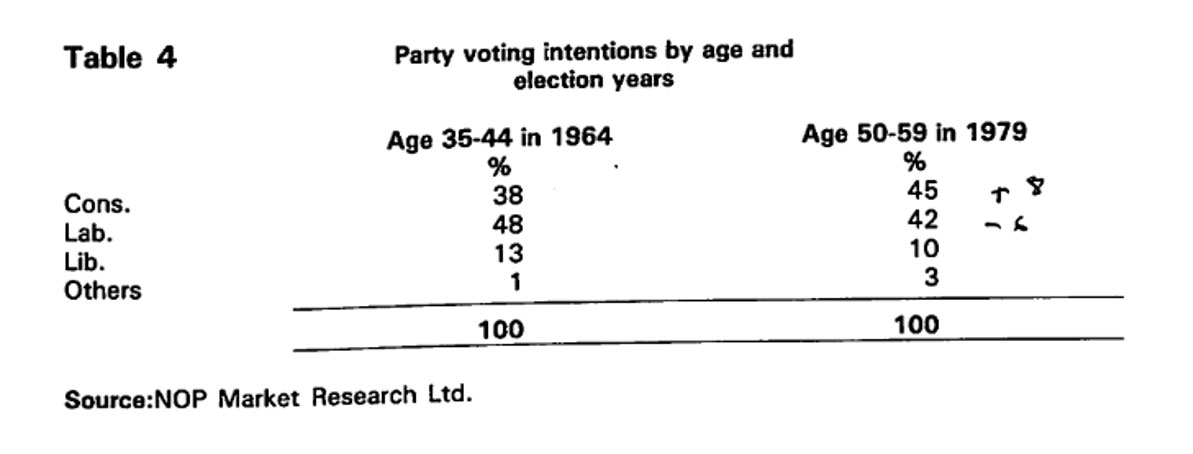
A source from the 1980s introduces many features of modern polling around voter intention. Concerned with how ageing might affect turnout and preference for political parties, Age Concern published a look at this question.
Some of the key questions involved in such queries include segmentation by economic class, gender, age. It allows for detailed analysis. In the table below the paper looks at how age might affect preference for the three main political parties. We can see that the theory about a shift to right wing parties was proven true based on the data presented in the paper. This table shows how people voted with a 15 year time gap to show the effect of time on preference.
We have established that young people vote differently to older voters according to the polling work in the AMSR. Previously there has been a trend for them to become more likely to vote Conservative as time goes by. However the polls do not always get it right when predicting voter intention: several sources from the 1990s held in the Archive for example (see links below) discuss the investigations into why the 1992 predictions were several percentage points off the real result. It led to questioning about the methods employed and consequences for how companies and those that rely on them thought about the power of polling.
- https://amsr.contentdm.oclc.org/digital/collection/PapersOffprnt/id/2611/rec/159
- https://amsr.contentdm.oclc.org/digital/collection/p21050coll1/id/215/rec/2
- https://amsr.contentdm.oclc.org/digital/collection/p21050coll1/id/199/rec/14
- https://amsr.contentdm.oclc.org/digital/collection/p21050coll1/id/673/rec/4
Closer to today a source from 2015, following another election which did not go as predicted in polls, demonstrated that the world we live in now might require different polling methods. Fewer people are likely to answer or have a landline phone, speak to pollsters on the doorstep or be representative as a bloc, these features pose new challenges for the art of prediction.
Why would any of these discussions matter? Well, we have seen that young people are one of the most unpredictable of the potential subgroups in the electorate, they make up their minds later, decide to turn up later, and have less knowledge and pattern in their voting due to not having gone through as many elections to form a set opinion. Understanding the way young people behave as voters is vital if political parties are to find ways to reach them and retain their vote over time. This piece has been prompted by the soon entrance of even more young people to the electorate, giving additional reason to try to improve methods and understanding.
Further reading and research
If you wish to know more about young people and voting, other sources of interest in the AMSR include 2016 TNS polling on the EU referendum. A political event which saw considerable reported differences between younger people’s voting preference and those of older voters.
There are also a couple of sources which allow us to compare various demographic indicators alongside age, and are useful if you have interest to think about the many potential ways to look at the electorate beyond one demographic indicator:
- https://amsr.contentdm.oclc.org/digital/collection/Verian/id/2280/rec/1
- https://amsr.contentdm.oclc.org/digital/collection/Verian/id/3464/rec/15
It is also worthwhile considering the potential effect that adding 16/17 year olds to the Electorate could have on outcomes. A reasonable current estimate is that there are c1.45 million 16–17-year-olds in the UK. And according to the Electoral Commission’s 2024 register statistics the UK parliamentary electorate is c47.4 million. Therefore even if all 16/17 year olds registered they only add about 3% to the total electorate.
Summary of Archive sources in this document:
Alex Tan
March 2026